
Navigating Market Liquidity: A Comprehensive Guide to Modern SMC Indicators

The Evolution of Institutional Analysis in Modern Trading
Trading the financial markets has undergone a massive transformation over the last decade. As we navigate the complexities of 2026, the reliance on traditional lagging indicators like simple moving averages or the basic RSI has diminished in favor of price action methodologies that track institutional behavior. Among these, Smart Money Concepts (SMC) has emerged as the gold standard for retail traders seeking to align themselves with the ‘whales’ of the market—banks, hedge funds, and central institutions.
The core philosophy of SMC is simple yet profound: the market is not random. It is a highly engineered environment where liquidity is sought and exploited. To trade successfully, one must understand where the ‘Smart Money’ is placing its orders. However, manually mapping out market structure, identifying order blocks, and spotting liquidity sweeps can be an exhaustive process. This is where a reliable SMC indicator becomes an essential part of a trader’s toolkit. In this guide, we will explore the mechanics of SMC and provide insights into finding and using a free SMC indicator to streamline your technical analysis.
Understanding the Core Pillars of Smart Money Concepts
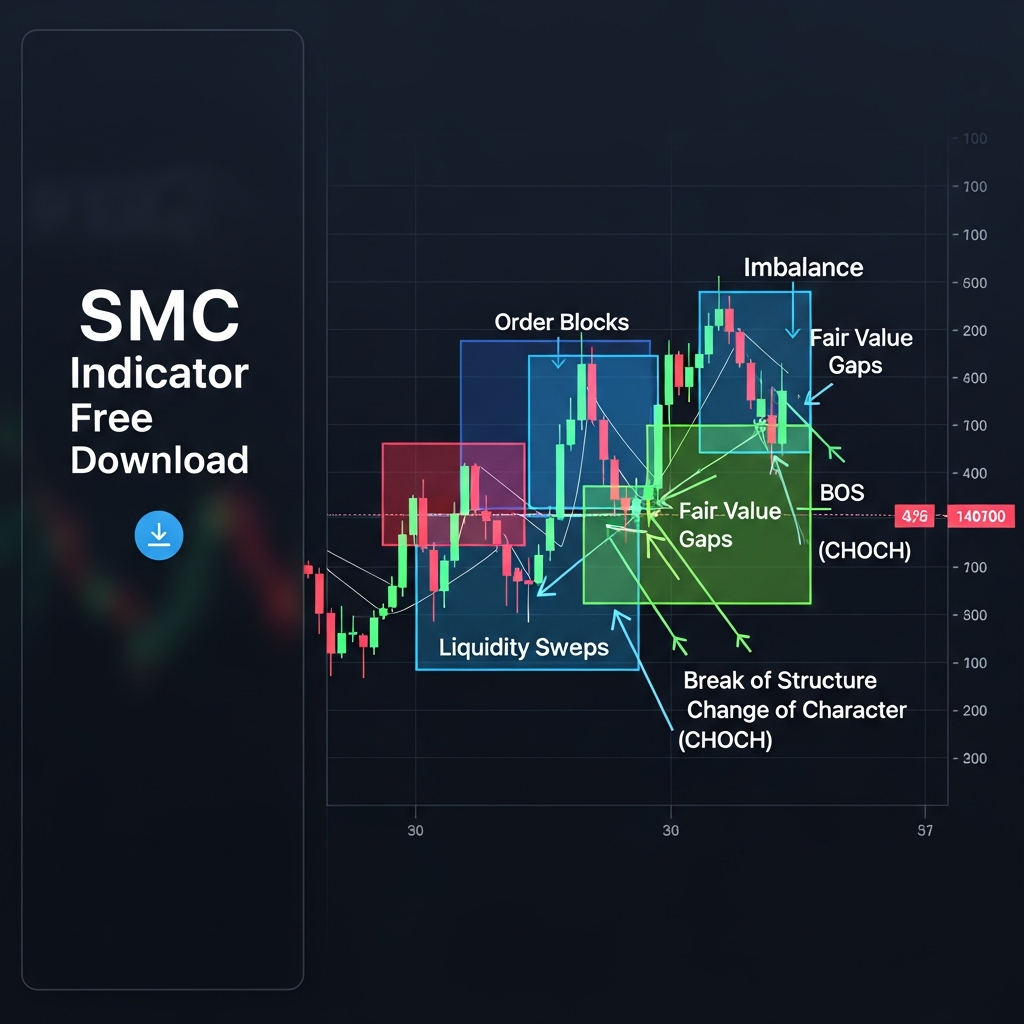
Before rushing to a download link, it is vital to understand what the indicator is actually calculating. SMC isn’t just a set of lines on a chart; it is a framework for reading the narrative of the market. Most high-quality SMC indicators focus on four primary elements.
1. Market Structure (BOS and CHoCH)
Market structure is the backbone of any SMC strategy. It involves identifying the trend through Break of Structure (BOS) and spotting potential reversals through a Change of Character (CHoCH). A BOS occurs when the price continues in its current direction, breaking a previous swing high or low. Conversely, a CHoCH is the first sign that the trend might be shifting, as the price fails to maintain its current trajectory and breaks the opposing swing point.
2. Order Blocks (OB)
Order blocks are essentially the footprints left by institutional players. They represent areas where a large volume of orders was executed, often resulting in a sharp move away from a specific price level. When price returns to these blocks, we often see a reaction because institutions may be ‘mitigating’ their remaining positions or adding to them. A good SMC indicator will automatically highlight these supply and demand zones.

3. Liquidity Zones
In the world of SMC, liquidity is the fuel that moves the market. Institutional players need a counterparty to fill their massive orders. This means they often drive price toward ‘retail stop losses’ located above previous highs (Buy-side Liquidity) or below previous lows (Sell-side Liquidity). Understanding where these ‘pools’ of liquidity sit allows a trader to avoid being the ‘exit liquidity’ for a larger player.
4. Fair Value Gaps (FVG)
Fair Value Gaps, or imbalances, occur when there is a rapid move in price that leaves a ‘hole’ in the market where only one side (buyers or sellers) was active. The market has a natural tendency to return to these gaps to ‘rebalance’ the price action. Indicators that highlight these gaps help traders identify high-probability targets and entry zones.
Why Use an SMC Indicator in 2026?
In the current trading landscape of 2026, algorithmic trading dominates over 80% of market volume. These algorithms are programmed to recognize specific price patterns and liquidity levels. While a human eye can certainly learn to spot an order block, an indicator provides several distinct advantages:
- Efficiency: Instead of spending 30 minutes mapping out multiple timeframes, an indicator does it in seconds across all pairs in your watchlist.
- Objectivity: Trading is emotional. An indicator provides a rule-based visual representation of the market, reducing the tendency to ‘see’ patterns that aren’t there.
- Precision: Modern SMC indicators are refined to exclude ‘fake’ breaks and low-probability zones, focusing only on the highest volume areas.
Finding a Quality SMC Indicator for Free Download
While there are many paid ‘premium’ scripts available, the open-source community has provided some of the most robust tools for SMC enthusiasts. Depending on your platform of choice—MetaTrader 4 (MT4), MetaTrader 5 (MT5), or TradingView—there are specific ways to access these tools without a subscription fee.
TradingView: The Hub of SMC Scripts
TradingView remains the most popular platform for SMC traders due to its Pine Script capabilities. You can find free versions of the SMC indicator by searching the ‘Community Scripts’ tab. Look for indicators by reputable developers like LuxAlgo (who often provide ‘lite’ or open-source versions) or other highly-rated community contributors. These scripts often combine BOS, CHoCH, OBs, and FVGs into a single, clean interface.
MT4 and MT5: The Institutional Standard
For those who prefer executing trades on MetaTrader, the MQL5 marketplace and various forensic trading forums offer free .ex4 or .ex5 files. When downloading a free SMC indicator for MT4/5, ensure you are getting a version that includes ‘Alerts.’ In 2026, the ability to receive a push notification when a CHoCH occurs on the 15-minute timeframe is a game-changer for those who cannot sit at their desks all day.
How to Install and Set Up Your SMC Indicator
Once you have found a reliable download, the setup process is straightforward. Here is a quick guide for MetaTrader users:
- Download the indicator file (usually ending in .mq4 or .ex4).
- Open your MT4/MT5 platform.
- Go to File > Open Data Folder.
- Navigate to MQL4 (or MQL5) > Indicators.
- Paste your downloaded file into this folder.
- Restart your platform or right-click ‘Indicators’ in the Navigator panel and hit ‘Refresh’.
- Drag the indicator onto your chart.
For TradingView users, it is even simpler. Just open a chart, click on the ‘Indicators’ button at the top, search for “Smart Money Concepts,” and click on a community script to apply it instantly.
Developing a Strategy Around the Indicator
Having the indicator is only half the battle; knowing how to trade with it is what separates profitable traders from the rest. A common and effective SMC strategy involves a top-down approach.
Step 1: Daily and H4 Bias
Use the indicator on the Daily or 4-hour timeframe to identify the overall market structure. Is the trend bullish (consecutive BOS to the upside)? If so, you should primarily be looking for ‘Buy’ entries at discounted order blocks.
Step 2: Identifying the Point of Interest (POI)
Look for an unmitigated order block or a Fair Value Gap on the H1 or H4 timeframe that aligns with your bias. This is your ‘Point of Interest.’ You are waiting for the price to return to this zone.
Step 3: Lower Timeframe Confirmation
Once the price enters your POI, drop down to the 5-minute or 1-minute timeframe. Wait for the indicator to show a CHoCH (Change of Character). This signals that the short-term momentum is shifting back in favor of the higher-timeframe trend. Enter on the retracement into the new lower-timeframe order block created by that CHoCH.
The Importance of Risk Management in SMC
A common pitfall for new SMC traders is the ‘Holy Grail’ fallacy. No indicator, regardless of how advanced its algorithm is in 2026, can predict the market with 100% certainty. SMC trades often offer high Reward-to-Risk (RR) ratios—sometimes as high as 1:10 or 1:20—but they also come with a lower win rate because the setups are highly specific.
It is crucial to manage your risk per trade. Most professional SMC traders never risk more than 0.5% to 1% of their account balance on a single position. Because the stop-loss is often placed just outside a ‘tight’ order block, even a small amount of market noise can trigger a loss. However, the high RR ensures that a single winning trade can cover multiple small losses.
Refining Your Edge: Manual vs. Automated Mapping
While a free SMC indicator download is a fantastic shortcut, the most successful traders use the indicator as a ‘second opinion’ rather than a primary source of truth. As you gain experience, you should practice mapping the structure yourself on a blank chart and then turning on the indicator to see if it agrees with your assessment. This builds ‘chart eye,’ which is a skill that no piece of software can replace.
In 2026, we are seeing more indicators incorporate ‘multi-timeframe’ (MTF) analysis into a single view. This means you can see H4 order blocks while looking at a 5-minute chart. This feature is invaluable for maintaining perspective on the ‘Big Picture’ while hunting for precise entries.
Conclusion: Taking the Next Step
The Smart Money Concepts framework offers a logical and structured way to interpret the chaos of the financial markets. By utilizing a free SMC indicator, you can drastically reduce the time spent on technical analysis and focus more on the psychological and execution-based aspects of trading. Whether you are trading Forex, Stocks, or Crypto, understanding institutional footprints is a skill that will remain relevant for years to come.
Remember that the goal of using an indicator is to provide clarity, not confusion. Start by downloading a reputable script, test it on a demo account, and gradually integrate it into a disciplined trading plan. The markets are constantly shifting, but the principles of liquidity and structure are timeless.