Mastering Price Discovery: Free Volume Profile Visible Range for MT4 in 2026
The Evolution of Market Analysis: Why Volume Profile Still Reigns in 2026
Trading in 2026 has become a battle of data. As the markets become increasingly saturated with algorithmic execution and high-frequency trading (HFT), retail traders have had to look beyond traditional lagging indicators like the RSI or moving averages. To truly understand where the ‘smart money’ is positioned, you need to look at price through the lens of volume distribution. Specifically, the Volume Profile Visible Range (VPVR) has become the gold standard for traders who want to see the market’s internal structure.
While platforms like TradingView have popularized the VPVR tool, many professional traders still rely on the robustness of MetaTrader 4 (MT4). The challenge? MT4 does not include a native Volume Profile tool by default. This guide will walk you through how to source, install, and effectively trade using a volume profile visible range mt4 free indicator, ensuring you have the same edge as institutional players without the monthly subscription costs.
What Exactly is the Volume Profile Visible Range (VPVR)?
To understand the Visible Range, we must first distinguish it from other types of volume analysis. Traditional volume—the vertical bars at the bottom of your chart—tells you when the volume occurred. Volume Profile, however, is horizontal. It tells you at what price level the volume occurred.
The “Visible Range” aspect is what makes this tool dynamic. Unlike a ‘Fixed Range’ profile where you manually select a start and end point, or a ‘Session Profile’ which only shows volume for the current day, the VPVR automatically adjusts. As you scroll left or right on your MT4 chart, or zoom in and out, the indicator recalculates the volume distribution for exactly what is visible on your screen. This provides an immediate visual representation of supply and demand for the specific timeframe and context you are currently analyzing.
Horizontal Volume vs. Vertical Volume
Think of vertical volume as the ‘effort’ put in by the market over a period of time. It shows intensity but lacks location. If you see a massive volume spike on a 1-hour candle, you know a lot of trading happened, but you don’t know if it happened at the top of the wick or the bottom of the body. Horizontal volume (VPVR) solves this by mapping every transaction to its specific price point. In the 2026 trading environment, where liquidity often hides in ‘dark pools,’ seeing the clusters of retail and institutional activity on your MT4 chart is indispensable.
The Core Components of the VPVR Indicator
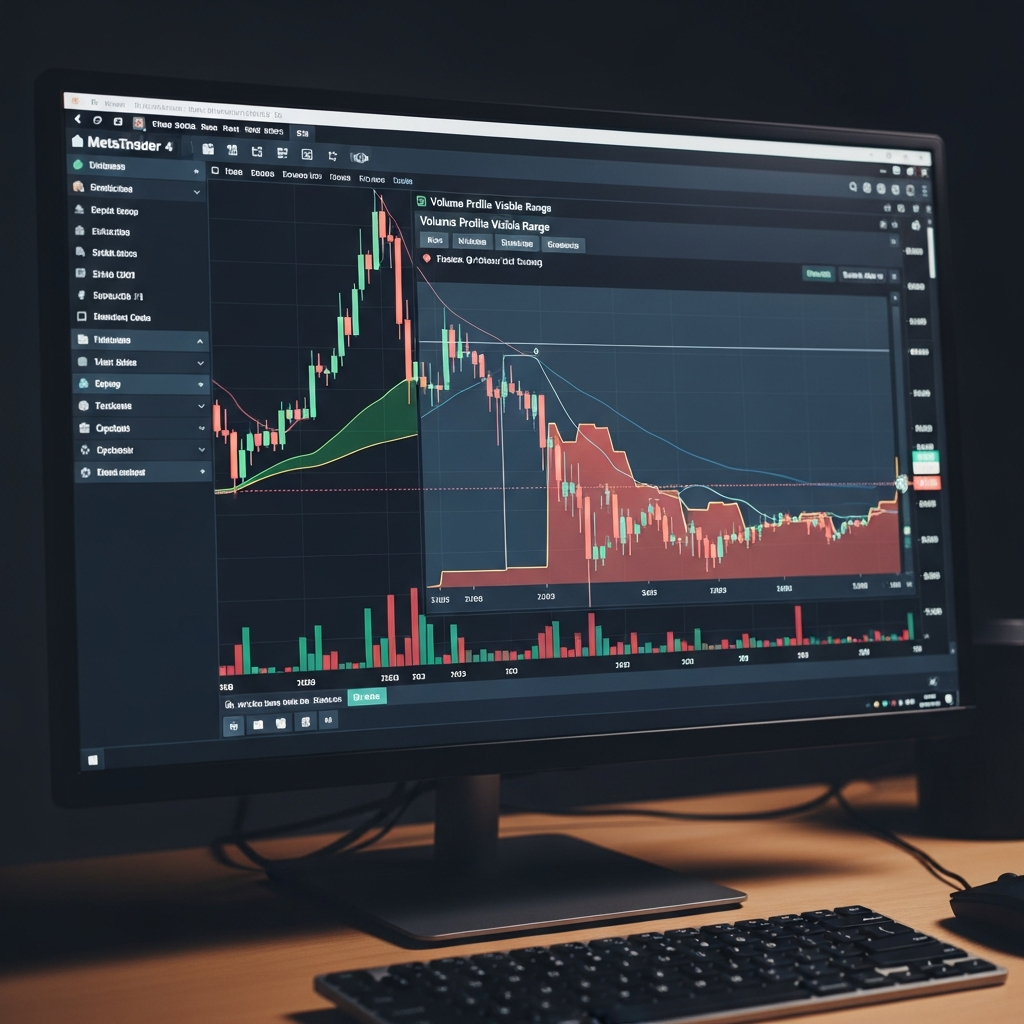
When you load a free VPVR indicator onto your MT4 platform, you will see a histogram on the side of your chart (usually the right side). There are three critical components you must understand to use this tool effectively:
1. The Point of Control (POC)
The POC is the single price level where the highest amount of volume was traded within the visible range. This is the ‘fairest’ price in the eyes of the market participants. In 2026, the POC often acts as a massive magnet. Price tends to return to the POC to find balance. If price is far away from the POC, it is considered ‘extended’ and likely to mean-revert.
2. The Value Area (VA)
The Value Area typically represents the price range where 70% of the total volume took place. This area consists of the Value Area High (VAH) and the Value Area Low (VAL). When price is inside the Value Area, the market is in a state of ‘acceptance.’ When price breaks out of the Value Area, it is searching for new value, often leading to a trend.
3. High Volume Nodes (HVN) and Low Volume Nodes (LVN)
High Volume Nodes are peaks in the profile. They represent areas where heavy trading occurred, often indicating consolidation or ‘fair value’ zones. Low Volume Nodes are the valleys. These are prices that the market skipped over quickly. In 2026, LVNs are incredibly important because they often act as zones of rejection. Because little trading happened there, there is no ‘support’ to stop the price, often causing price to ‘slip’ through these zones rapidly.
Finding a Reliable Free Volume Profile Visible Range Indicator for MT4
Since MetaQuotes (the developers of MT4) never included a native volume profile, the community has filled the gap. You don’t need to pay $50 or $100 for a ‘premium’ version on the MQL5 Market. Many open-source developers have created highly efficient versions that use ‘Tick Volume’ to calculate the profile.
Note: In Forex, we use Tick Volume (the number of price changes) as a proxy for actual traded volume. Studies have shown that Tick Volume in the Forex market has a 90% correlation with real exchange-traded volume, making it perfectly viable for Volume Profile analysis.
Where to Look:
- Forex Station: A long-standing community where developers share modified and updated MT4 indicators. Look for the “VPVR” or “Market Profile” threads.
- MQL5 Market (Free Section): Search for “Volume Profile” and filter by ‘Free.’ Often, developers offer a ‘Lite’ version of their visible range tool that includes all the essential features.
- GitHub Repositories: For the more tech-savvy, searching for ‘MQL4 Volume Profile’ on GitHub often yields clean, unbloated code that performs significantly better on older computers.
How to Install and Setup the Indicator on MT4
- Download the .ex4 or .mq4 file: Once you find your preferred free VPVR indicator, save the file to your desktop.
- Open MT4 Data Folder: In your MT4 platform, go to File > Open Data Folder.
- Navigate to Indicators: Go to MQL4 > Indicators.
- Paste the file: Move the downloaded file into this folder.
- Refresh: Right-click on ‘Indicators’ in your MT4 Navigator window and select ‘Refresh.’
- Apply to Chart: Drag the indicator onto your desired chart.
Pro Tip for 2026: Ensure your indicator settings are set to ‘Visible Range’ rather than ‘All History.’ Loading volume data for 10 years of history on a 1-minute chart will likely crash your MT4 terminal. Set the ‘Step’ or ‘Width’ of the bars to a setting that looks clean on your screen—usually a setting of 50-100 bars for the profile is sufficient.
Strategic Trading with the Visible Range
Having the tool is one thing; knowing how to trade it is another. Here are three strategies that remain highly effective in today’s market.
Strategy 1: The POC Rejection
When price approaches a Point of Control from a long-term visible range, it is likely to stall. Traders look for price action confirmation—like a pin bar or an engulfing candle—at the POC. Because the POC represents the highest liquidity, it takes a significant amount of ‘new’ money to push price through it. If that volume doesn’t appear, the price will bounce. This is a favorite for mean-reversion traders.
Strategy 2: Trading the ‘Void’ (LVN)
Low Volume Nodes are like vacuum zones. If price breaks out of a High Volume Node and enters an LVN, it will often move very quickly to the next HVN. Why? Because there are no orders sitting in that price range to slow it down. In 2026, savvy traders use these ‘voids’ to set profit targets, knowing that the ‘path of least resistance’ is through the thin volume.
Strategy 3: The Value Area Breakout
Institutional accumulation often happens within the Value Area. When price finally breaks and closes outside the Value Area High (VAH), it signals that the market has reached a consensus that the current price is ‘too cheap.’ This is often the start of a strong bullish trend. Conversely, a break below the VAL signals a bearish trend. The retest of the VAH or VAL from the outside is often the highest-probability entry point.
Common Mistakes When Using Volume Profile
Even with a high-quality free MT4 indicator, traders often fall into these traps:
- Ignoring the Trend: A POC in a strong uptrend is more likely to act as a ‘pause’ than a ‘reversal.’ Always align your volume analysis with the higher-timeframe trend.
- Over-complicating the Chart: It is tempting to have multiple profiles open at once. In 2026, the key is clarity. Use the VPVR to identify the big zones, and then use your standard price action tools to find the entry.
- Confusing Tick Volume with Real Volume: While tick volume is a great proxy for Forex, it isn’t perfect. Always be aware of major news events where tick volume might spike due to spread widening rather than actual massive trade execution.
Conclusion: Why the Free Option is Often Better
In the current trading landscape of 2026, many ‘premium’ tools are simply repackaged versions of community-driven code. By utilizing a volume profile visible range mt4 free indicator, you save capital that is better used in your trading account. The logic behind the volume profile is mathematical and objective—it doesn’t change because a tool is expensive.
Whether you are a scalper looking for micro-rejections at the POC or a swing trader identifying long-term value zones, the VPVR is a transformative addition to the MT4 platform. It turns a two-dimensional chart into a three-dimensional map of market psychology. Download a version today, spend time observing how price reacts to high-volume clusters, and you will quickly see why this is the preferred tool for the professional trading community.