Mastering Momentum: The Essential Guide to Real-Time Trend Strength Meters
The Invisible Force: Why Direction Isn’t Enough
In the high-velocity landscape of 2026 trading, identifying the direction of a market is no longer the competitive advantage it once was. With algorithmic execution and institutional AI bots scanning every tick, price direction is merely the baseline. The real ‘alpha’ lies in understanding the intensity of that movement. This is where the real-time trend strength meter becomes an indispensable tool for the modern trader.
A trend strength meter does exactly what its name suggests: it quantifies the vigor of a price move. It answers the question, ‘Is this a sustainable breakout, or is the buying pressure already exhausted?’ By measuring the internal health of a trend, these tools allow traders to filter out ‘noise’ and focus exclusively on high-probability setups. In a world where volatility is the new constant, knowing when to step on the gas and when to stay on the sidelines is the difference between a profitable quarter and a catastrophic drawdown.
The Difference Between Price Action and Trend Velocity
Many novice traders confuse price movement with trend strength. They see a long green candle and assume the trend is strong. However, experienced professionals know that price action can be deceptive. A sharp move on low volume is often a ‘bull trap’—a momentary spike designed to lure in liquidity before a reversal. A real-time trend strength meter looks beneath the surface, analyzing variables like volume flow, rate of change, and statistical deviation to provide a clearer picture of market conviction.
The Anatomy of a High-Performance Strength Meter
Modern trend strength meters in 2026 have evolved far beyond the simple ADX (Average Directional Index) calculations of the early 2000s. While those foundational tools are still relevant, today’s real-time meters integrate multiple data streams to provide a more holistic view.
1. Directional Harmony
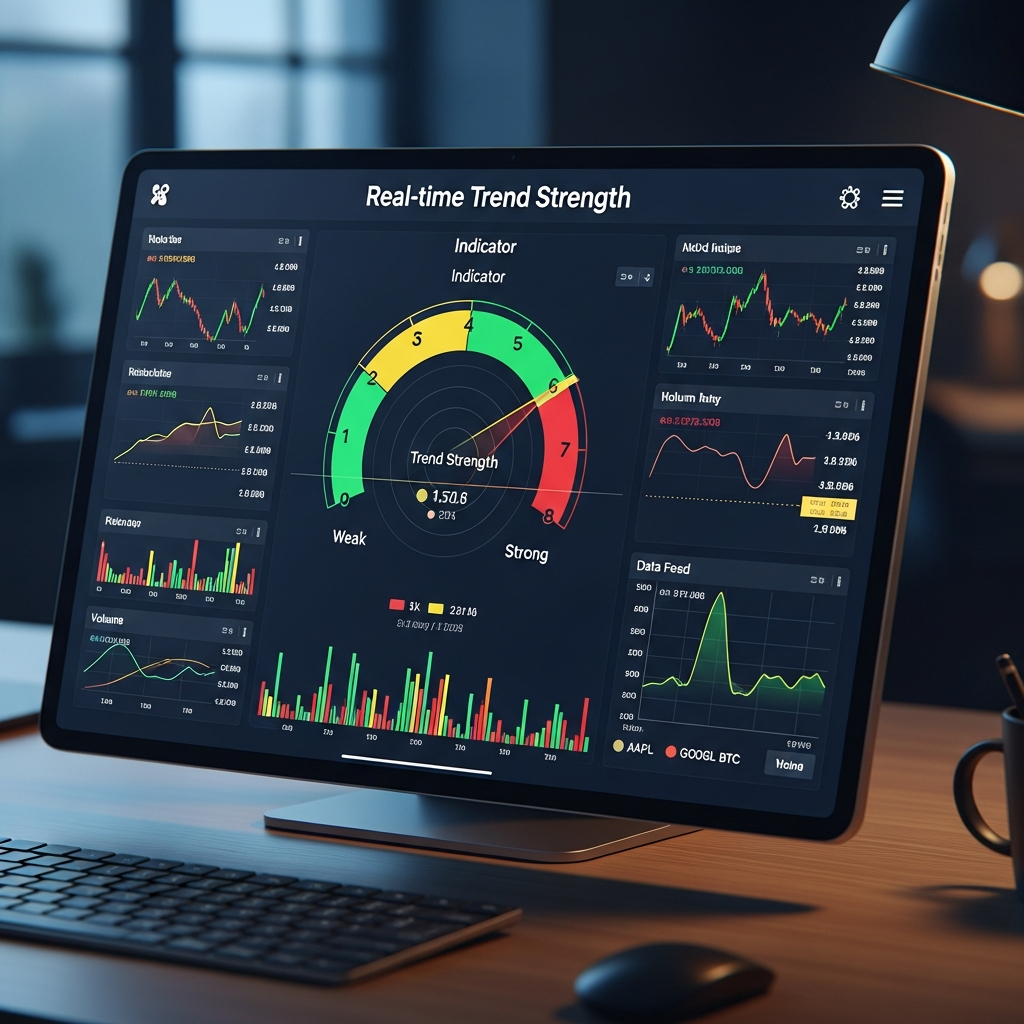
At its core, a strength meter checks for alignment across multiple timeframes. If the 5-minute, 1-hour, and Daily charts are all flashing green, the ‘harmony’ is high. A real-time meter visualizes this instantly, often using a heatmap or a numerical score. When these timeframes are in sync, the probability of a sustained move is exponentially higher.
2. Volatility-Adjusted Momentum
Standard momentum indicators often fail during periods of extreme volatility. Contemporary strength meters use adaptive algorithms—often incorporating elements of Bollinger Band width or Keltner Channels—to adjust for the current ‘market noise’ level. If the price is moving fast but staying within historical volatility bounds, the strength meter might remain neutral. It only signals a strong trend when the move breaks away from the expected statistical range.
3. Liquidity and Volume Integration
A trend without volume is a house built on sand. The most effective real-time meters incorporate ‘Volume at Price’ or ‘Order Flow’ data. By seeing where the big money is actually placing bets, the meter can confirm if a trend has institutional backing or if it’s merely retail FOMO (Fear Of Missing Out).
Strategic Implementation: How to Read the Meter
Using a real-time trend strength meter isn’t about following a signal blindly. It’s about building a confluence of evidence. Here is how professional traders integrate these tools into their workflow:
Filtering Entry Points
Instead of entering a trade the moment a price hits a support or resistance level, a trader will wait for the strength meter to cross a specific threshold. For example, on a scale of 0 to 100, a trader might only enter long positions when the strength score is above 65. This ensures that the momentum is already in their favor before they commit capital.
Managing Exits and Trailing Stops
One of the hardest parts of trading is knowing when to take profits. A real-time strength meter acts as an early warning system. When the price is still going up, but the strength meter begins to diverge or decline, it’s a clear signal that the trend is losing steam. This allows the trader to tighten their stop-loss or scale out of the position before the inevitable reversal occurs.
Avoiding the ‘Chop’
Sideways markets are where most accounts go to die. A strength meter provides a quantitative way to define ‘choppy’ conditions. If the meter is fluctuating near its midpoint (e.g., between 40 and 50), it suggests there is no dominant side in control. This is the ‘wait and see’ zone, keeping the trader out of low-probability environments.
The Psychology of Strength: Confidence in Execution
Trading is as much a mental game as it is a technical one. One of the overlooked benefits of a real-time trend strength meter is the psychological stability it provides. When you enter a trade based on a gut feeling, every small pullback feels like a threat. However, when you have a data-driven tool confirming that the trend strength remains robust despite a minor retracement, you are much less likely to exit your position prematurely.
In 2026, where market sentiment can shift in milliseconds due to a single social media post or an unexpected data release, having an objective anchor is vital. The meter removes the emotional ‘noise’ and allows for cold, calculated execution.
Common Pitfalls: Why ‘Hot’ Meters Can Sometimes Lie
No tool is infallible. While trend strength meters are powerful, they are not magic crystals. Traders must be aware of two specific risks: Lag and Exhaustion.
The Lag Factor
Most indicators are ‘lagging,’ meaning they look at historical data to predict the future. Even ‘real-time’ meters have a microscopic delay because they require at least a few ticks of data to calculate a change in strength. In hyper-fast markets, a strength meter might show a ‘strong’ reading just as the trend is actually ending.
The Overextension Trap
When a meter reaches its absolute maximum (e.g., 99/100), the trend is often ‘overextended.’ This is a counter-intuitive moment where the trend is at its strongest, but also at its most vulnerable. Entering at the absolute peak of a strength reading is often entering at the moment of maximum greed—right before the ‘smart money’ starts taking profits.
Integrating Trend Strength with 2026 AI Tools
As we move through 2026, the integration of generative AI and predictive analytics has taken trend strength meters to the next level. We are now seeing ‘Predictive Strength Meters’ that don’t just tell you how strong a trend is, but how strong it is likely to be over the next 15 minutes. These systems analyze historical patterns and current macro-economic sentiment to forecast momentum shifts before they appear in the price action.
For a retail trader, this means that simple indicators are no longer enough. To compete, one must use a multi-faceted approach where the real-time strength meter is part of a larger ecosystem involving sentiment analysis and macro-economic data feeds.
Conclusion: The Bottom Line on Trend Strength
A real-time trend strength meter is the dashboard of your trading vehicle. Just as a driver wouldn’t ignore their speedometer or fuel gauge, a trader shouldn’t ignore the intensity of the market move. In the fast-paced, AI-driven markets of 2026, these tools provide the clarity needed to navigate complexity.
By quantifying momentum, identifying exhaustion, and filtering out the noise of sideways markets, trend strength meters allow you to trade with the wind at your back. Whether you are a day trader looking for scalps or a swing trader targeting major market shifts, mastering the ‘strength’ of the move is your primary path to consistent profitability. Remember: direction tells you where the market might go, but strength tells you if it has the power to get there.