
Cracking the Code: High-Frequency Trading Indicators for Modern Retail Traders
The Great Democratization of Speed
For decades, the world of High-Frequency Trading (HFT) was a gated community. To even stand a chance at observing the patterns used by the world’s most sophisticated algorithms, a retail trader needed six-figure hardware, colocation in proximity to exchange servers, and a Ph.D. in quantitative finance. However, as we navigate through 2026, the landscape has fundamentally shifted. The technology that once defined the ‘Flash Boys’ era has filtered down into the hands of the retail public.
Today, high-frequency trading indicators for retail traders are no longer just about speed—they are about information density. While a retail trader will likely never beat a multi-billion dollar firm in a race of raw latency, they can now use the same footprints these firms leave behind to make informed, high-probability trades. This article explores the sophisticated world of HFT indicators adapted for the retail environment, focusing on how to read the pulse of the market at its most granular level.
Understanding the HFT Footprint
Before diving into specific indicators, we must understand what HFT actually does. High-frequency algorithms provide liquidity, exploit tiny price discrepancies, and front-run large institutional orders. In doing so, they leave massive amounts of data in the Limit Order Book (LOB) and the Time and Sales (Tape). For a retail trader, an HFT indicator is essentially a filter that removes the noise of slow-moving retail traders and highlights the mechanical, high-speed movements of the ‘bots.’
1. Order Flow Imbalance (OFI)
Order Flow Imbalance is the bread and butter of HFT-style retail trading. While a standard volume indicator tells you how much was traded, OFI tells you who is being more aggressive. In 2026, modern platforms compute this in real-time by analyzing the changes in the bid and ask levels alongside the actual trades executed.
When an HFT algorithm wants to move the market, it doesn’t just buy; it consumes liquidity at the ask while simultaneously refreshing its own bid to push the price higher. An OFI indicator tracks this imbalance. If you see a massive spike in OFI on the buy side without an immediate price breakout, you are witnessing ‘absorption’—an HFT signature where a large seller is soaking up all the aggressive buying. Recognizing this prevents retail traders from buying into a local top.
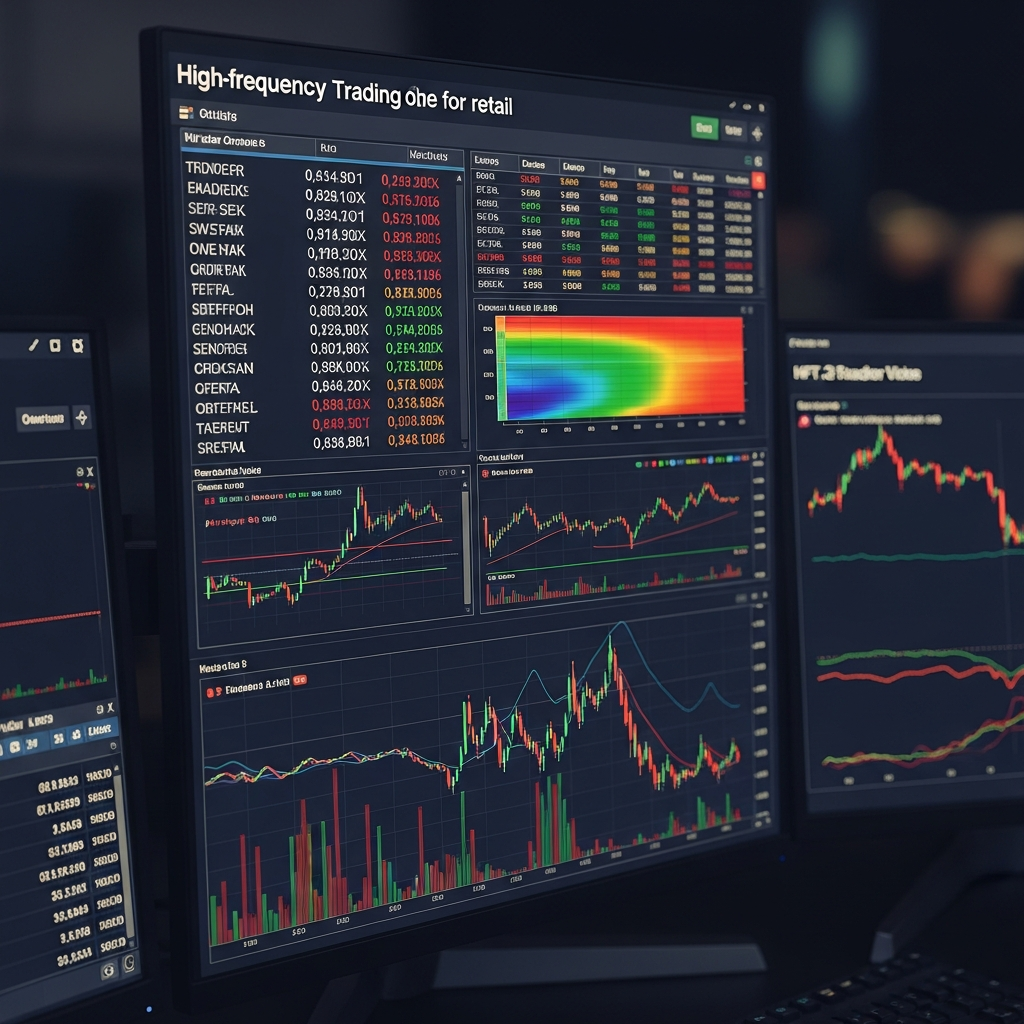
2. The Order Book Heatmap (Depth of Market)
Perhaps the most visually impactful tool in the retail HFT toolkit is the Heatmap. Instead of looking at static levels, a heatmap visualizes the history of the Limit Order Book over time.
By looking at a heatmap, you can see where ‘spoofing’ occurs. Spoofing is a technique where HFTs place large orders with no intention of filling them, simply to scare the market in a certain direction. For a retail trader, seeing a massive block of liquidity appear and then disappear as the price approaches it is a clear signal of manipulation. In 2026, retail tools have become sophisticated enough to color-code these orders based on their ‘intent’ and ‘age,’ allowing traders to ignore the fake liquidity and focus on the real ‘resting’ orders that act as magnets for price.
The Role of Cumulative Volume Delta (CVD)
Cumulative Volume Delta is often misunderstood as a simple momentum oscillator. In the context of high-frequency analysis, however, it serves a much deeper purpose. CVD measures the net difference between buying and selling volume at the market (aggressive orders).
Divergence as an Alpha Signal
The true power of CVD for retail traders lies in divergence. If the price of an asset is making new highs, but the CVD is flat or declining, it indicates that while the price is moving up, the ‘aggressive’ participants are actually selling. This usually means the price move is being driven by ‘passive’ limit orders or by a lack of liquidity rather than true conviction. HFTs often exploit these ‘thin’ moves to trap retail traders, and by monitoring CVD, you can spot the trap before it snaps shut.
Microstructure Volatility Indicators
In the high-frequency world, volatility isn’t just a daily percentage move; it’s calculated on a tick-by-tick basis. Retail platforms now offer indicators that measure Microstructure Noise. This is a calculation of how much the price oscillates within a single candle without actually changing the trend.
High microstructure noise often precedes a massive directional expansion. When HFTs are fighting for position at a specific level, they generate immense noise. By using an indicator that measures the ‘Efficiency Ratio’ of price movement, retail traders can wait for the noise to subside—signaling that one side has won the battle—before entering a trade.
Tick-Based VWAP and Standard Deviation Bands
The Volume Weighted Average Price (VWAP) is the ‘fair value’ anchor for almost every institutional algorithm. However, standard daily VWAP is too slow for high-frequency insights. Retail traders now use Rolling VWAP or Anchor VWAP set to specific high-volume events (like the market open or a news release).
The ‘Mean Reversion’ Trap
HFT algorithms are designed to push price back to the VWAP when it overextends. By using 1st, 2nd, and 3rd standard deviation bands around the VWAP, retail traders can identify ‘overbought’ or ‘oversold’ conditions through the lens of institutional logic. If the price reaches the 3rd deviation band on high tick-velocity, the probability of an HFT-driven mean reversion trade back to the VWAP increases exponentially.
The Importance of Latency-Adjusted Data
As we operate in 2026, the ‘speed’ of data delivery to your screen is paramount. Many retail traders use standard ‘delayed’ or ‘aggregated’ data feeds from their brokers. However, HFT indicators require Unfiltered Tick Data (Level 2). This data shows every single price change and every single order update.
Without unfiltered data, HFT indicators are essentially lying to you. They are showing you a ‘summary’ of what happened rather than the ‘reality’ of what is happening. For the modern retail trader, investing in a high-quality data feed is more important than any specific strategy or bot. It is the raw material that powers the indicators mentioned above.
How to Implement an HFT Strategy as a Retailer
Having the indicators is one thing; trading them is another. You cannot ‘scalp’ for fractions of a penny like an HFT firm. Instead, you must use these indicators to find ‘high-conviction’ zones. Here is a standard workflow for a retail trader using HFT tools:
- Step 1: Identify Liquidity Magnets. Look at the Order Book Heatmap to see where the largest resting orders are (institutional interest).
- Step 2: Monitor OFI for Commitment. As price approaches a liquidity zone, check the Order Flow Imbalance. Are the ‘aggressive’ buyers/sellers stepping in, or is the move slowing down?
- Step 3: Look for CVD Divergence. Confirm if the move into the zone is supported by volume or if it’s a ‘fakeout’ driven by low liquidity.
- Step 4: Execute on Tick-Velocity. Watch the tape (Time and Sales). When the speed of transactions (ticks per second) increases, it signals that the algorithms have been triggered. This is your entry or exit signal.
The Risks: Latency, Slippage, and ‘The Bot Fight’
It would be irresponsible to discuss HFT indicators without mentioning the risks. The primary risk for retail is Execution Latency. Even if your indicator tells you exactly what the HFTs are doing, by the time you click ‘Buy’ and your order reaches the exchange, the window of opportunity may have closed. This leads to slippage, where you are filled at a price significantly worse than expected.
Furthermore, HFT firms are aware that retail traders now use these tools. They have developed ‘anti-retail’ algorithms designed to mimic the signals that retail HFT indicators look for, only to reverse the trade immediately. This is why it is crucial to use a ‘confluence’ of indicators rather than relying on a single signal.
The 2026 Landscape: AI-Enhanced HFT Indicators
The most significant change in 2026 is the integration of Artificial Intelligence with HFT indicators. Modern retail platforms now offer ‘Pattern Recognition’ overlays that use neural networks to identify when the current Order Flow signature matches a historically successful setup. Instead of just seeing ‘red’ or ‘green’ delta, the AI tells you, “This specific delta pattern has led to a 70% probability of a 10-tick move within the next 2 minutes.”
This symbiosis of human intuition and algorithmic precision is what defines the ‘Pro-Retail’ trader of today. We are no longer guessing; we are measuring.
Conclusion: The Future is Micro
The gap between the institutional trading desk and the home office has never been narrower. By using High-Frequency Trading indicators like Order Flow Imbalance, Heatmaps, and Tick-based VWAP, retail traders can finally see the ‘gears’ of the market turning.
However, the key to success in 2026 remains the same as it was in 1926: Discipline. HFT indicators provide you with a high-definition microscope, but they don’t tell you how to trade. They are tools of perception, not guarantees of profit. For the trader who takes the time to master the nuances of market microstructure, the rewards are immense. The market is a conversation between algorithms, and with the right indicators, you can finally understand the language.