
Mastering Market Momentum: The Ultimate Guide to MTF RSI Dashboards for MetaTrader 5
The Evolution of Momentum Trading in 2026
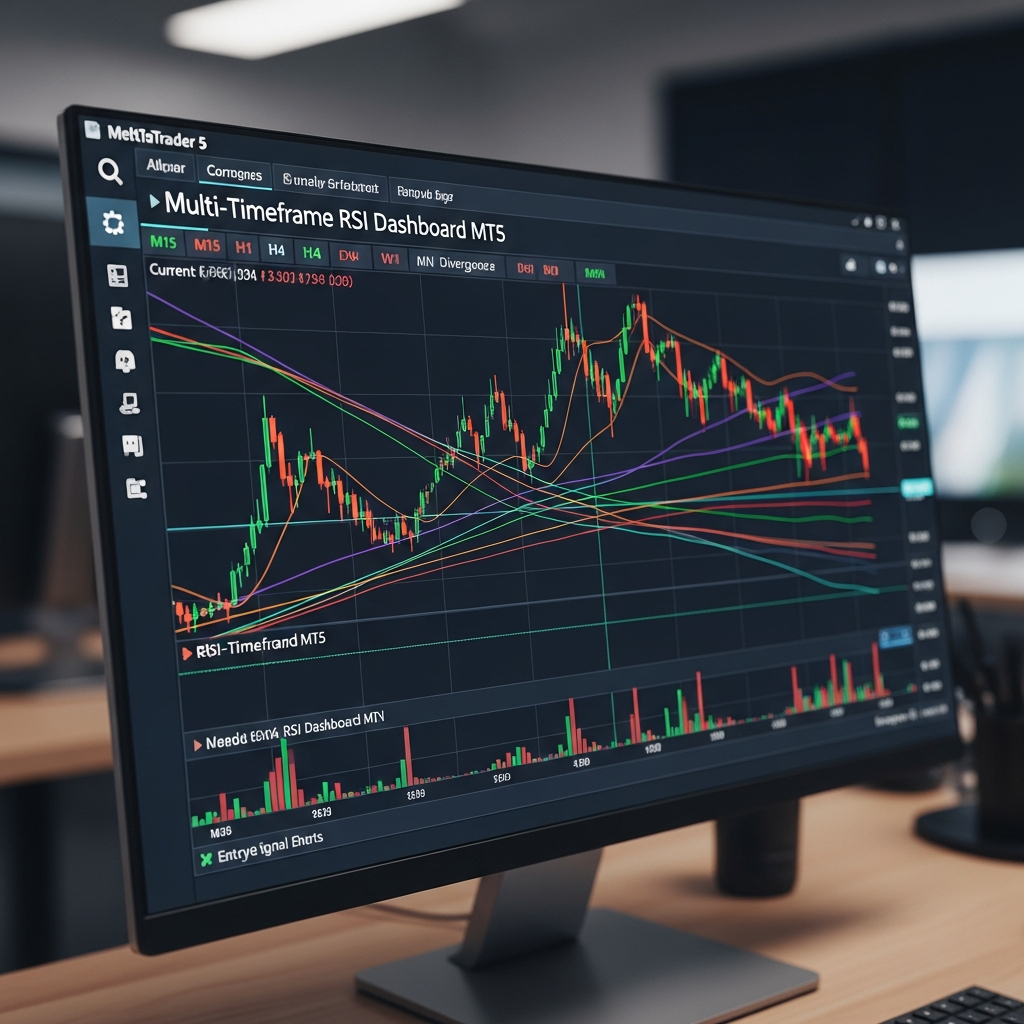
Trading in 2026 has become a game of data synthesis. Gone are the days when a retail trader could rely on a single indicator on a single chart to find an edge. As institutional algorithms become more sophisticated, retail traders have had to adapt by using tools that provide a broader view of market structure without cluttering their workspace. This is where the multi-timeframe (MTF) RSI dashboard for MT5 steps in as an essential component of a modern trading station.
The Relative Strength Index (RSI) remains one of the most trusted momentum oscillators ever created. However, its true power isn’t found in isolation. The most successful traders today look for confluence across multiple time horizons. By visualizing the RSI values of M5, M15, H1, H4, and Daily timeframes simultaneously, you gain a perspective that a single chart simply cannot offer. This guide explores the mechanics, strategies, and technological advantages of using an MTF RSI dashboard in the current MetaTrader 5 environment.
Why Multi-Timeframe Analysis is No Longer Optional
In the fast-paced markets of 2026, price action often looks like noise if you only view it through one lens. A classic trap for novice traders is seeing an “oversold” RSI reading on a 5-minute chart and entering a long position, only to be crushed because the 4-hour and Daily charts are in a massive downtrend with their RSI values hovering in the mid-30s. This is known as trading against the higher-timeframe momentum.
Multi-timeframe analysis allows you to align your entries with the ‘big picture.’ When the Daily RSI is bullish and the 15-minute RSI dips into oversold territory, you aren’t just buying a dip; you are buying a pullback within a confirmed macro uptrend. This significantly increases your win rate and risk-to-reward ratio. An integrated MT5 dashboard automates this cross-referencing process, saving you from clicking through a dozen different tabs.
Core Features of a Premium MT5 RSI Dashboard
When searching for or building the ideal dashboard for MetaTrader 5, certain features are non-negotiable for professional-grade performance. In 2026, the standard has moved beyond simple colored boxes.
1. Real-Time Multi-Symbol Monitoring
A high-performance dashboard should allow you to monitor your entire watchlist—Forex pairs, Commodities, Indices, and Crypto—on a single screen. This global view ensures you never miss a setup because you were focused on the ‘wrong’ pair.
2. Dynamic Alert Systems
Modern MTF dashboards feature push notifications, email alerts, and desktop pop-ups. You can set conditions such as: “Alert me when the RSI is Overbought on M30, H1, and H4 simultaneously.” This level of filtering ensures that you only receive signals for high-confluence setups.
3. Visual Customization and UX
The MetaTrader 5 engine allows for advanced graphical rendering. A good dashboard uses heatmaps or gradient colors to represent RSI intensity. This makes it possible to gauge the ‘heat’ of the market at a glance, rather than reading raw numbers.
4. Sorting and Filtering
Efficiency is key. You should be able to sort your symbols based on their RSI value. If you are a mean-reversion trader, you want the most overbought symbols at the top. If you are a trend-follower, you want to see which pairs are holding steady in the 50-60 range across all timeframes.
Strategies for the MTF RSI Dashboard
Having the data is one thing; knowing how to trade it is another. Here are three professional strategies specifically designed for use with an MTF RSI dashboard.
The Trend Alignment Strategy
This is a high-probability approach favored by swing traders. The goal is to find assets where the long-term momentum is strongly directional.
- H4 and Daily RSI: Must be above 60 (Bullish) or below 40 (Bearish).
- M15 and M30 RSI: Look for the opposite extreme. If the Daily is bullish, wait for the M15 to drop below 30.
- Execution: When the lower timeframe RSI starts to turn back in the direction of the higher timeframe, you enter. The dashboard makes identifying these ‘corrections’ effortless.
The Overextended Mean Reversion
In 2026, markets frequently experience “flash” moves driven by algorithmic spikes. When a currency pair becomes overextended across every timeframe, a correction is almost inevitable.
- The Setup: Look for a symbol where the RSI is above 70 (or 80) across the M5, M15, M30, H1, and H4.
- The Logic: The asset is extremely overbought. The dashboard will show a row of bright red (or your chosen ‘overbought’ color) across all columns.
- Entry: Enter a short position once the M5 RSI crosses back below the 70 level, using the recent swing high as a stop loss.
The 50-Level Pivot Strategy
The 50-level of the RSI is often ignored but is arguably the most important. It represents the balance of power between buyers and sellers. When a dashboard shows multiple timeframes crossing from below 50 to above 50 at the same time, it signals a massive shift in momentum. This is often the start of a new, sustained trend.
Why MetaTrader 5 (MT5) is the Superior Platform
While many traders still cling to MT4, the technical requirements of a multi-symbol, multi-timeframe dashboard make MT5 the clear winner in 2026. MT5 handles multi-threading much more efficiently. If you are monitoring 20 symbols across 6 timeframes, that is 120 RSI calculations happening every tick.
On MT4, this can lead to terminal lag or even crashing. MT5’s 64-bit architecture and advanced memory management ensure that your dashboard remains responsive, even during high-volatility events like central bank announcements or NFP releases. Furthermore, MT5 provides more native timeframes (like H2 or H8), giving you more granular control over your dashboard settings.
The Psychology of Dashboard Trading
One of the hidden benefits of using an MTF RSI dashboard is the reduction of ‘analysis paralysis.’ When you have too many charts open, your brain struggles to process the conflicting information. You might see a buy signal on one chart but a sell signal on another, leading to hesitation.
A dashboard consolidates this information into a single source of truth. It forces a disciplined approach: if the dashboard doesn’t show the required confluence, you don’t take the trade. This systematic approach is vital for longevity in the trading world. By removing the need to constantly flip through charts, you lower your cognitive load, allowing you to focus on risk management and trade execution.
Setting Up Your Dashboard for Success
To get the most out of your MT5 RSI dashboard, follow these optimization steps:
- Select Relevant Symbols: Don’t track 100 symbols if you only have the margin to trade 5. Focus on the major pairs and perhaps a few highly liquid indices.
- Define Your Zones: Standard RSI levels are 30 and 70. However, in trending markets, you might find that 40 and 80 work better as support/resistance zones for the oscillator. Experiment with these settings based on current 2026 market volatility.
- Integration with Other Tools: Use the RSI dashboard as a filter, not a sole trigger. Combine it with price action (Support/Resistance) or volume profile to confirm your entries.
- Backtest Your Confluence: Use the MT5 Strategy Tester to see how often triple-timeframe RSI alignments actually resulted in profitable moves for your specific asset.
Common Pitfalls to Avoid
Even with the best tools, trading carries risk. Avoid these common mistakes when using a dashboard:
- Ignoring the News: No RSI reading can withstand a surprise interest rate hike. Always keep an economic calendar alongside your dashboard.
- Chasing the “Perfect” Row: You might wait days for a symbol to be perfectly aligned across all timeframes. Don’t be afraid to take high-quality setups where 4 out of 5 timeframes align if the price action is compelling.
- Over-Optimization: Don’t change your RSI periods (usually 14) too frequently. Changing settings every time you have a losing trade is a recipe for disaster. Consistency is your best friend.
Conclusion: The Future is Integrated
As we navigate the complexities of the financial markets in 2026, the MTF RSI dashboard for MetaTrader 5 stands out as a bridge between traditional technical analysis and modern data efficiency. It empowers the individual trader to see the market with the clarity of a professional desk, filtering out the noise and highlighting the moments where momentum is truly in their favor.
Whether you are a scalper looking for rapid-fire entries or a swing trader seeking the security of higher-timeframe alignment, integrating a multi-timeframe dashboard into your MT5 setup is a decisive step toward more disciplined and profitable trading. Efficiency, clarity, and confluence—these are the hallmarks of a successful modern strategy.