
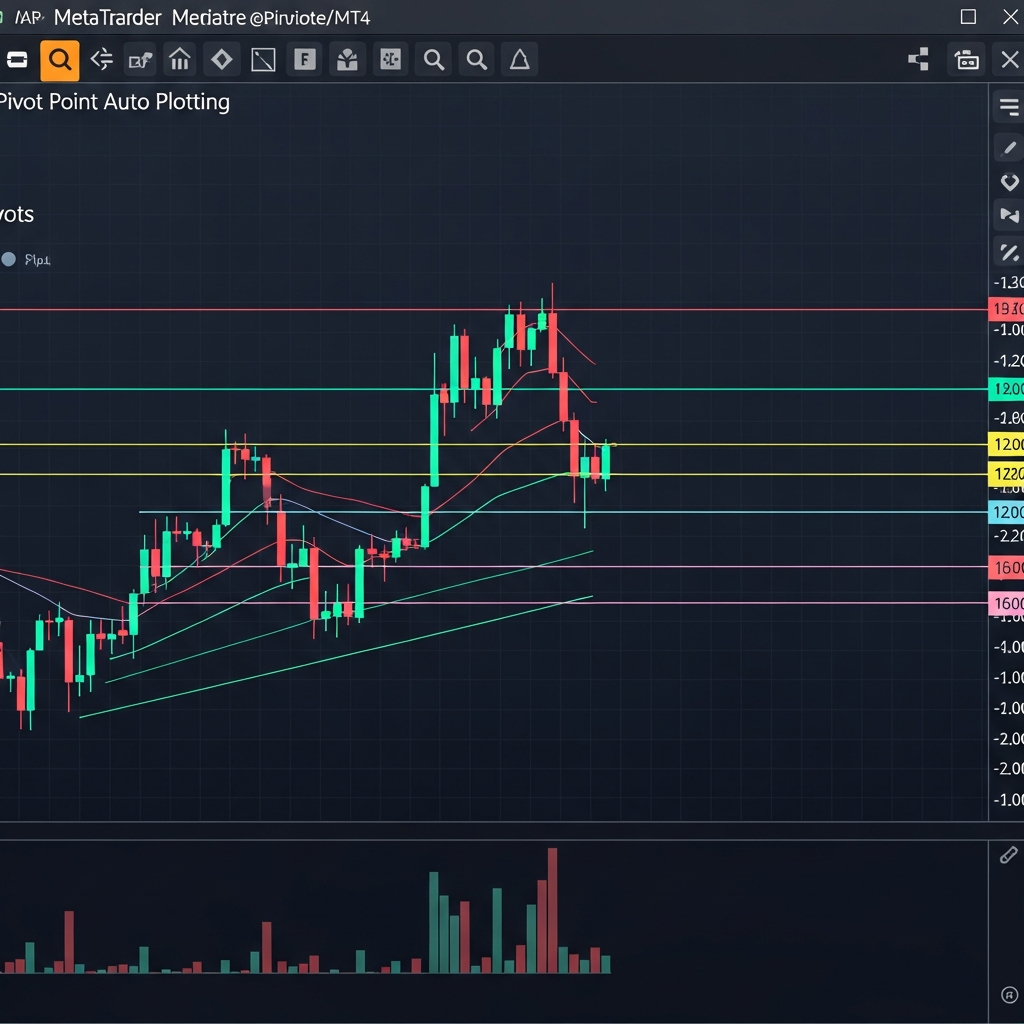
Mastering the Markets: How to Use Pivot Point Auto Plotting on MT4 for Consistent Trading
The Evolution of Technical Analysis: Why Pivot Points Still Reign Supreme
In the rapidly shifting landscape of the 2026 financial markets, where high-frequency trading and AI-driven algorithms dominate the order flow, retail traders are constantly searching for a baseline of stability. Amidst the noise of modern technical indicators, the classic Pivot Point remains one of the most reliable tools in a professional trader’s arsenal. Originally used by floor traders on the Chicago Board of Trade, these mathematical levels provide a clear roadmap of where price is likely to react, stall, or reverse.
However, the days of manually calculating the high, low, and close of the previous day and drawing lines on a chart are long gone. The modern standard is pivot point auto plotting on MT4. This automation doesn’t just save time; it eliminates human error and ensures that you are looking at the same institutional levels as the biggest players in the market. In this comprehensive guide, we will explore how to leverage automated pivot points to sharpen your entries and exits.
Understanding the Logic Behind Pivot Point Calculations
Before diving into the automation aspect, it is crucial to understand what these lines actually represent. At its core, a Pivot Point (PP) is the average of the previous period’s high, low, and closing prices. From this central axis, several layers of support (S1, S2, S3) and resistance (R1, R2, R3) are derived.
The Standard Floor Pivot
This is the most common version. The calculation is straightforward:
- Pivot Point (PP) = (High + Low + Close) / 3
- Resistance 1 (R1) = (2 x PP) – Low
- Support 1 (S1) = (2 x PP) – High
- Resistance 2 (R2) = PP + (High – Low)
- Support 2 (S2) = PP – (High – Low)
When you use an auto-plotting indicator on MT4, the software performs these calculations the microsecond a new candle opens, projecting the levels across your screen instantly. This allows you to focus on price action rather than arithmetic.
The Benefits of Auto Plotting in MT4
MetaTrader 4 remains the industry standard for retail forex trading because of its versatility with custom MQL4 scripts. Utilizing an auto-plotting indicator offers several distinct advantages over manual charting:
1. Objective Market Perspective
Manual drawing is often influenced by trader bias. If you are bullish, you might subconsciously ignore a resistance level. An automated indicator is cold and clinical; it plots the levels based strictly on historical data, providing an objective framework for your trading day.
2. Multi-Timeframe Synchronization
Sophisticated MT4 pivot indicators allow you to plot daily, weekly, and even monthly pivots on a single 15-minute or 1-hour chart. Seeing where a daily R1 aligns with a weekly Pivot Point creates a “Confluence Zone,” which significantly increases the probability of a successful trade.
3. Instant Adaptation to Volatility
In 2026, market volatility can spike due to geopolitical shifts or centralized bank digital currency (CBDC) announcements. Auto-plotting indicators adjust to the range of the previous day immediately. If the market had a massive 200-pip range yesterday, your pivot levels today will be wider, accounting for that increased volatility without any manual input required.
Types of Pivot Points Available for MT4
While the Standard Floor Pivot is the most popular, different market conditions may call for different mathematical approaches. Most high-end MT4 auto-plotters allow you to toggle between these versions:
Camarilla Pivots
Developed by Nick Scott in the 1980s, Camarilla pivots focus on the closing price of the previous day. They are particularly effective for mean-reversion strategies. Traders look for price to stay within the S3 and R3 levels, with breakouts occurring only at the S4/R4 levels.
Woodie’s Pivots
Woodie’s pivots give more weight to the current opening price. This makes the levels more reactive to the immediate market sentiment at the start of a session. Many intraday scalpers prefer Woodie’s for fast-moving pairs like GBP/JPY.
Fibonacci Pivots
These combine traditional pivot logic with Fibonacci retracement levels (0.382, 0.618, etc.). If you are a fan of Fibonacci-based trading, having these levels auto-plotted ensures your support and resistance areas align with the natural mathematical ratios found in market movements.
Strategic Implementation: How to Trade with Auto-Plotted Pivots
Simply having lines on your chart isn’t enough; you need a repeatable system. Here are three high-probability strategies for 2026.
Strategy 1: The Central Pivot Bounce
In a trending market, the Central Pivot (PP) acts like a magnet and a springboard. If the market is in an uptrend (making higher highs), wait for a retracement back to the central Pivot Point. If a bullish reversal candle (like a pin bar or engulfing pattern) forms right on the auto-plotted line, it serves as a high-probability entry point to go long, targeting R1 and R2.
Strategy 2: The Breakout-Retest at R1/S1
When the market opens significantly above or below the central pivot, it signals strong momentum. If price breaks through R1 with high volume, do not chase the move. Instead, wait for the auto-plotted R1 level to be tested from above. In technical analysis, broken resistance often becomes new support. This “flip” is one of the most reliable setups for day traders.
Strategy 3: The Overextended Reversal (S3/R3)
It is statistically rare for price to move beyond the S3 or R3 levels in a single trading session without some form of retracement. If you see price touching an auto-plotted S3 level and the RSI is showing oversold conditions, the probability of a bounce back toward the S2 or the Central Pivot is extremely high. This is often referred to as “trading the extremes.”
Customizing Your MT4 Pivot Indicator for Maximum Clarity
To succeed with pivot point auto plotting on MT4, your chart layout must be clean. Here are some optimization tips for your indicator settings:
- Color Coding: Always set your Resistance levels to a warm color (like Red or Orange) and Support levels to a cool color (like Blue or Green). Set the Central Pivot to a neutral color like White or Grey.
- Labeling: Ensure your indicator has text labels enabled. It’s much easier to react when you see “Daily R2” clearly labeled next to the line.
- Historic Data: Choose an indicator that allows you to see past pivots. This helps you backtest and see how the pair reacted to these levels in previous weeks.
- Session Timing: Markets like Forex operate 24/5. Ensure your indicator is set to the correct “Start of Day” time (usually Midnight GMT or New York Close) to ensure the calculations match institutional charts.
The Importance of Confluence in 2026
As we navigate the trading environment of 2026, relying on a single indicator is rarely sufficient. Pivot points work best when they align with other structural elements. This is known as confluence.
Look for instances where an auto-plotted S1 level aligns perfectly with a 200-period Moving Average or a psychological “round number” (like 1.1000 on EUR/USD). When multiple tools point to the same price level, the “self-fulfilling prophecy” effect is magnified. Thousands of other traders and algorithms are seeing the same confluence, leading to a massive influx of orders at that specific price, which creates the price action we want to trade.
Risk Management and Pivot Points
No trading tool is 100% accurate. Pivot points provide the map, but you must still manage the vehicle. A common mistake is placing a stop loss exactly on a pivot level. Since these levels are so well-known, “stop hunting” often occurs around them. It is wiser to place your stop loss 5-10 pips beyond the level to allow for market noise.
Additionally, use pivots for your Take Profit targets. If you enter at the Central Pivot, R1 is your first logical place to take partial profits, while R2 serves as your final target. This structured approach to exit management removes the emotional temptation to “hold and hope.”
Conclusion: Integrating Automation into Your Routine
Pivot point auto plotting on MT4 is more than just a convenience; it is a necessity for the modern trader who values precision and efficiency. By automating the calculation of these critical support and resistance levels, you free up mental capital to focus on what truly matters: reading price action and managing risk.
Whether you are a scalper looking for quick bounces at S1 or a swing trader using weekly pivots to catch major trend reversals, the clarity provided by these automated levels is unparalleled. As you refine your strategy in 2026, let the math of the markets guide your decisions. Download a reliable auto-plotting pivot indicator, customize it to your visual preference, and start trading with the confidence that comes from seeing the market’s true structural framework.