
Simplifying Market Analysis with Automated Fibonacci Retracement Tools for MT5
The Evolution of Technical Precision in Modern Trading
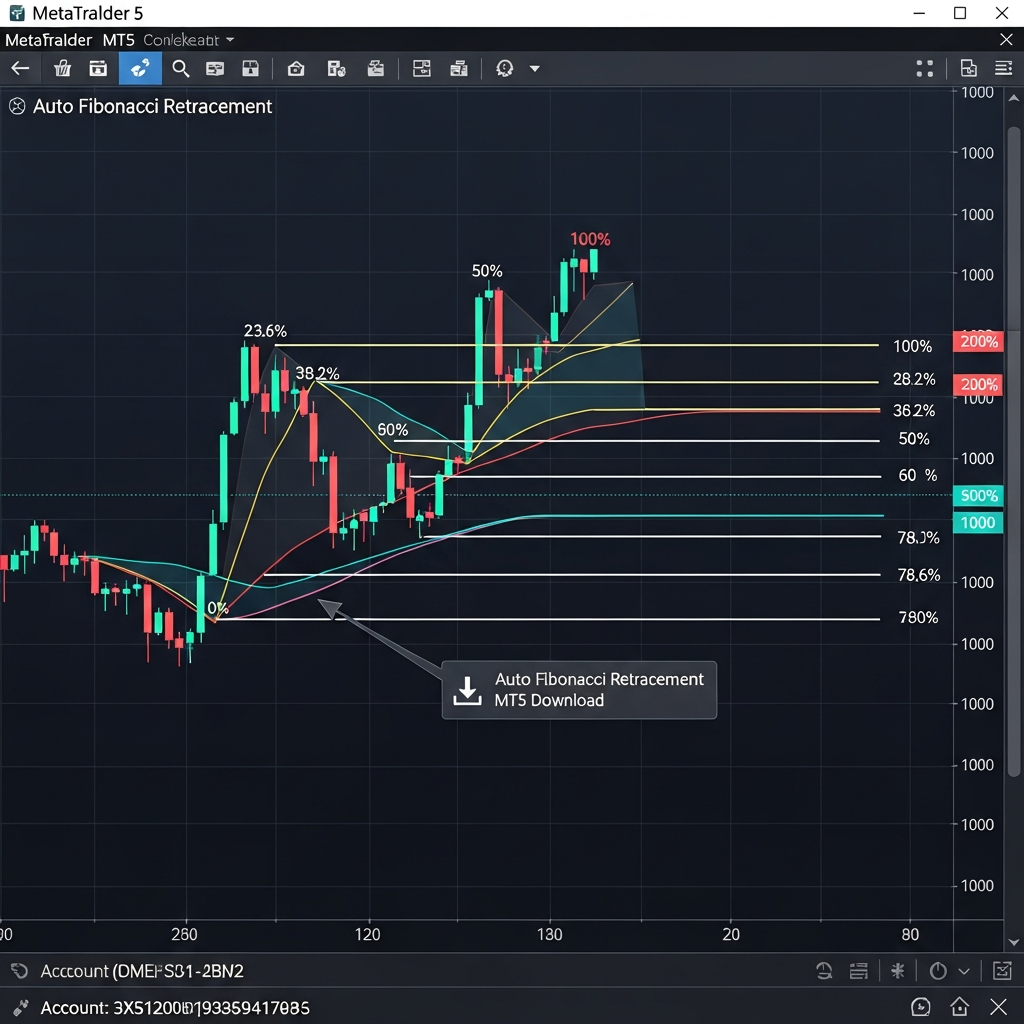
For decades, Fibonacci retracement levels have stood as a cornerstone of technical analysis. Based on the mathematical sequences discovered by Leonardo Bonacci nearly 800 years ago, these ratios—0.236, 0.382, 0.500, 0.618, and 0.786—have a peculiar way of manifesting in financial markets as psychological support and resistance zones. However, as we navigate the trading landscape of 2026, the method of applying these tools has undergone a significant transformation.
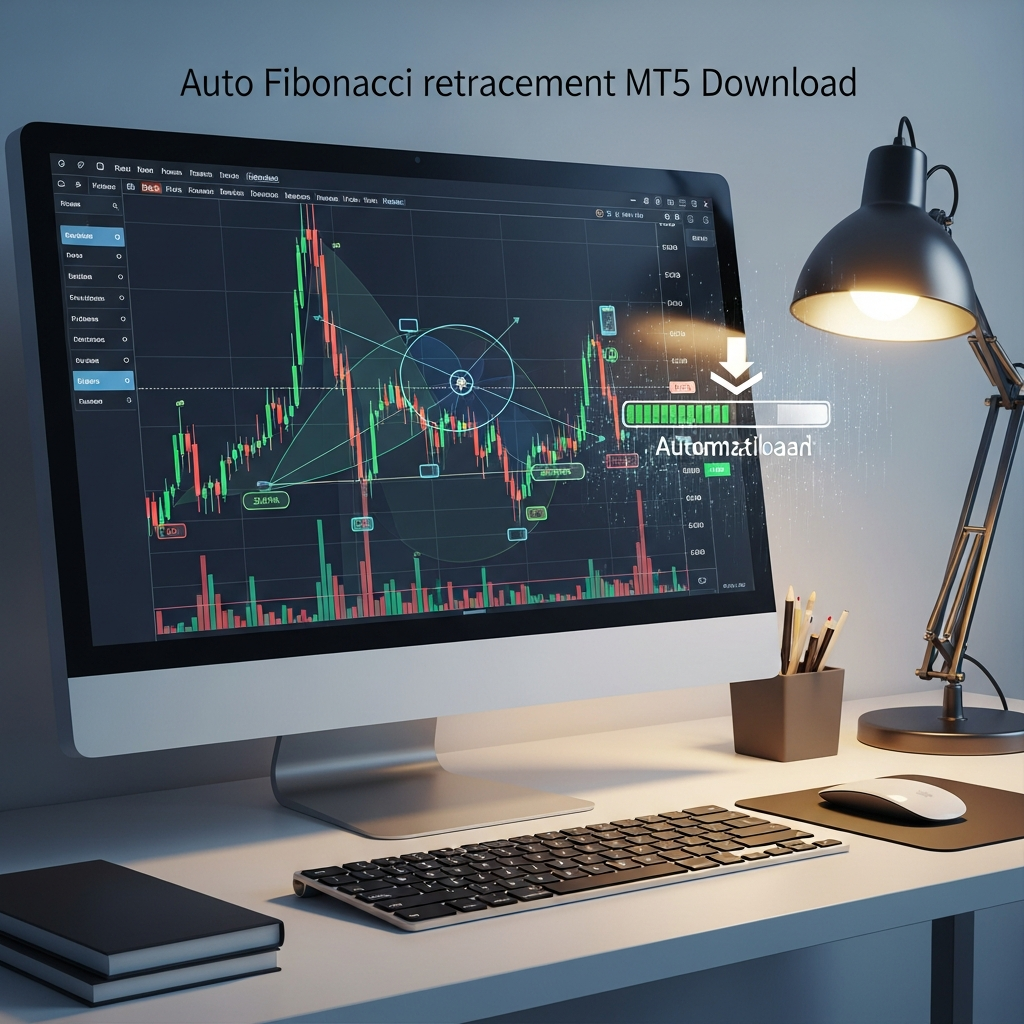
In the past, traders would manually drag the Fibonacci tool from a perceived swing high to a swing low. This process, while seemingly simple, is fraught with subjectivity. One trader’s local high might be another trader’s noise. As the speed of the MetaTrader 5 (MT5) platform continues to outpace its predecessor, the demand for automation has grown. An auto Fibonacci retracement indicator for MT5 removes the guesswork, dynamically updating levels as the market carves out new peaks and troughs.
Why Automation is Essential for Fibonacci Analysis
The primary challenge with manual Fibonacci plotting is the lag time. By the time a trader identifies a swing point and manually draws the levels, the price may have already tested the 38.2% level and moved on. In a high-volatility environment, seconds matter.
Eliminating Human Bias
We are naturally biased toward our existing trades. If you are long on a pair, you might subconsciously pick a swing low that justifies a support level near the current price. Automated indicators use strict algorithmic logic—often based on ZigZag patterns or price action fractals—to identify the most mathematically significant points. This objectivity is crucial for maintaining a disciplined trading plan.
Real-Time Adjustments
Markets are fluid. A swing high established in the morning might be invalidated by a sudden news breakout in the afternoon. An automated MT5 indicator detects these shifts instantly, recalculating the ratios and redrawing the lines without user intervention. This ensures that your chart always reflects the most current market structure.
Key Features of a High-Quality Auto Fibonacci MT5 Indicator
When searching for an auto Fibonacci retracement MT5 download, not all tools are created equal. A premium indicator should offer more than just basic lines; it needs to provide context and customization.
Multi-Timeframe Analysis
The most effective Fibonacci levels are those that align across multiple timeframes—a concept known as confluence. A sophisticated MT5 tool can display levels from the H4 or Daily chart while you are trading on the M15 timeframe. Seeing that a 61.8% retracement on the hourly chart matches a 38.2% level on the daily chart provides a much higher probability of a successful trade.
Customizable Sensitivity (Depth and Deviation)
Markets have different “textures.” A low-volatility pair like EUR/CHF requires different sensitivity settings than a volatile asset like Bitcoin or Gold. A good indicator allows you to adjust the “Depth” (the minimum number of candles between highs/lows) and “Deviation” (the percentage change required to identify a new point). This customization ensures the tool adapts to the specific instrument you are trading.
Integrated Alert Systems
In 2026, traders are rarely tethered to their desks for 12 hours a day. Modern indicators include push notifications and email alerts. When the price touches the “Golden Ratio” (0.618), the indicator can send a notification to your mobile MT5 app, allowing you to execute trades on the go.
How to Install and Setup the Indicator on MetaTrader 5
Once you have found a reputable auto Fibonacci retracement MT5 download, the installation process is straightforward. Because MT5 uses the MQL5 language, it is highly efficient and handles complex calculations with minimal CPU drag.
- Download the File: Usually, the file will have an .ex5 extension.
- Open the Data Folder: In your MT5 platform, go to File > Open Data Folder.
- Navigate to Indicators: Go to the MQL5 folder, then open the Indicators subfolder. You can create a new folder named “AutoFib” to keep things organized.
- Paste the File: Move your downloaded .ex5 file into this folder.
- Refresh and Apply: Return to MT5, right-click on “Indicators” in the Navigator window, and select “Refresh.” Drag your new indicator onto the desired chart.
After applying the indicator, you will typically see a settings window. Ensure that “Allow DLL imports” is checked if the indicator requires external data processing, though most standard MQL5 indicators do not need this.
Strategic Application: Trading the Golden Ratio
Having the levels on your chart is only half the battle; knowing how to trade them is what determines profitability. The automated tool is a map, not a compass. You still need to decide which direction to walk.
Trend Continuation Strategy
The most common use of Fibonacci retracements is entering a trend on a pullback. In a healthy uptrend, the price rarely moves in a straight line. It breathes. When the auto-indicator identifies a pullback to the 50% or 61.8% level, traders look for bullish candlestick patterns (like hammers or engulfing bars). Because the indicator is automated, it will keep these levels visible even as the trend extends to new highs.
The 78.6% Deep Retracement
Often overlooked by beginners, the 78.6% level is a favorite for institutional traders. It represents a deep discount in a bullish trend. When the automated tool highlights this zone, it often correlates with a “stop run” where retail stops are cleared before the original trend resumes. Using an automated tool allows you to see these deep zones clearly without cluttering your chart with manual lines from every minor swing.
Combining Auto Fibonacci with Other Technical Indicators
Relying solely on Fibonacci levels can be risky. To increase your edge, use the automated levels as part of a broader system.
Moving Average Confluence
A powerful setup occurs when an automated Fibonacci level aligns with a major moving average, such as the 50-period or 200-period SMA. If the 61.8% retracement sits exactly on top of the 200 SMA, the psychological weight of that support level is doubled. The MT5 platform excels at calculating these multi-layered data points simultaneously.
RSI Divergence
When the price reaches an automated Fibonacci resistance level (e.g., the 0.382 in a downtrend), check the Relative Strength Index (RSI). If the price is hitting the resistance but the RSI is showing a lower high (bearish divergence), the probability of a reversal from that Fibonacci level increases dramatically.
Common Mistakes to Avoid
While automation brings efficiency, it doesn’t replace the need for critical thinking. Here are a few pitfalls to avoid when using an auto Fibonacci tool in 2026:
- Over-adjusting Sensitivity: If you set the indicator to be too sensitive, your chart will be cluttered with hundreds of tiny retracement levels that have no market significance. Aim for “Major” swing points for better reliability.
- Ignoring Market Context: During high-impact news events (like central bank interest rate decisions), technical levels are often ignored. No Fibonacci level, automated or manual, can stop a fundamental momentum shift.
- Ignoring the Trend: Fibonacci retracements work best in trending markets. In a sideways or “choppy” market, the indicator will constantly redraw levels as the price oscillates, leading to false signals.
The Future of Fibonacci: Machine Learning and MT5
As we look deeper into 2026, the integration of AI and machine learning into MQL5 indicators is becoming more prevalent. Some advanced auto Fibonacci tools now use neural networks to filter out “false” swing highs—points that look like peaks but lack the volume or institutional participation to be significant. By downloading a modern MT5 version of this tool, you are leveraging the most advanced computational power available to retail traders.
The speed of MQL5 allows these indicators to scan dozens of pairs simultaneously. Imagine an indicator that not only draws the Fibonacci levels on your current chart but also scans the entire Market Watch window to alert you when any pair touches its daily 61.8% level. This is the level of efficiency that defines the current era of trading.
Final Thoughts
The transition from manual drawing to using an auto Fibonacci retracement MT5 download represents a natural progression for the serious trader. It is about moving from a place of subjective interpretation to one of objective, algorithmic execution. By automating the identification of swing points, you free up mental capital to focus on what really matters: risk management and trade psychology.
Whether you are a scalper looking for quick 23.6% bounces or a swing trader waiting for the deep 78.6% discount, the precision offered by the MT5 platform ensures you are seeing the market as it truly is. In the fast-paced markets of 2026, precision isn’t just an advantage—it’s a requirement for survival.