Mastering the Fibonacci Golden Zone Indicator for MT4: The 2026 Comprehensive Trading Guide
Mastering the Fibonacci Golden Zone Indicator for MT4: The 2026 Comprehensive Trading Guide
Technical analysis has evolved significantly over the decades, yet certain mathematical constants remain the bedrock of market prediction. Among these, the Fibonacci sequence stands supreme. In 2026, professional traders are increasingly moving away from cluttered charts toward streamlined, high-probability tools. The Fibonacci Golden Zone Indicator for MT4 is at the forefront of this shift, offering a visual representation of where price is most likely to reverse and continue its primary trend.
Whether you are a seasoned swing trader or a scalper looking for micro-pullbacks, understanding the ‘Golden Zone’—specifically the area between the 50% and 61.8% retracement levels—can be the difference between a losing streak and a consistent equity curve. In this guide, we will explore the mechanics of this indicator, how to implement it on the MetaTrader 4 platform, and the specific strategies that are yielding results in today’s volatile markets.
What is the Fibonacci Golden Zone?
The Fibonacci sequence, discovered by Leonardo of Pisa in the 13th century, is a series of numbers where each number is the sum of the two preceding ones. When we translate these ratios into financial markets, we look at ‘retracements.’ After a significant move up or down, the market rarely continues in a straight line. Instead, it ‘breathes’ or retraces.
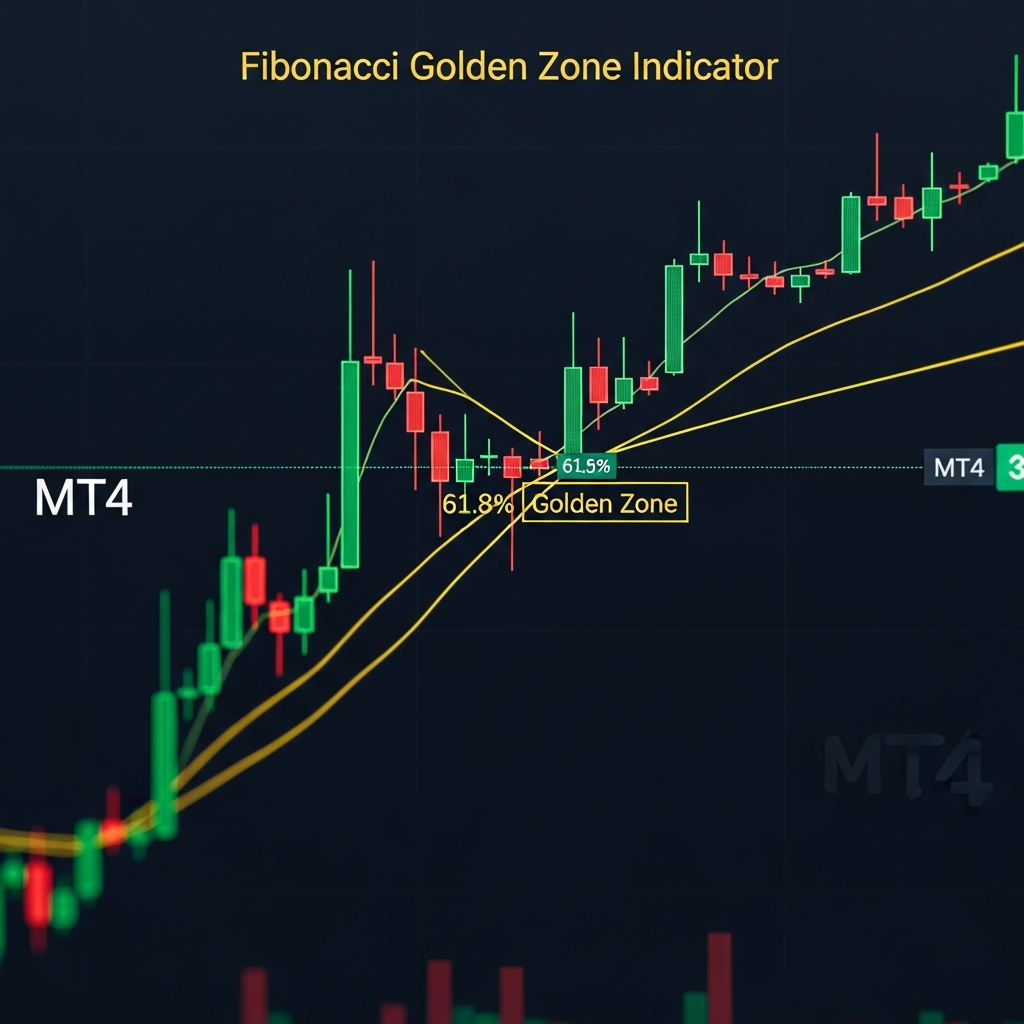
The Golden Zone refers to the specific cluster of retracement levels that institutional algorithms and retail traders alike watch most closely. While the 38.2% level is common in strong trends, the 50% and 61.8% levels (the latter being the ‘Golden Ratio’) represent the sweet spot for entries. The Fibonacci Golden Zone Indicator for MT4 automates the identification of these zones, removing the subjectivity of manual drawing.
The Mathematics of 61.8%
The 0.618 ratio is found everywhere in nature, from the spiral of galaxies to the architecture of sea shells. In trading, it represents a point of deep value. When a stock or currency pair retraces to this level, it has given back enough of its gains to attract new buyers, but not so much that the original trend is considered broken. In 2026, as high-frequency trading (HFT) dominates the landscape, these ‘mathematical magnets’ act as liquidity pools where orders are filled at scale.
Why Use the MT4 Version of the Indicator?
MetaTrader 4 remains the world’s most popular platform for retail forex traders due to its stability and the vast ecosystem of custom indicators. The standard Fibonacci tool in MT4 requires you to identify the ‘swing high’ and ‘swing low’ yourself. This can be problematic because two different traders might pick two different points, leading to inconsistent results.
The Fibonacci Golden Zone Indicator for MT4 solves this by:
- Automated Swing Detection: It uses zig-zag logic or fractal analysis to identify the most relevant high and low points automatically.
- Visual Clarity: It highlights the 50%-61.8% area with a distinct color box, making it impossible to miss.
- Real-time Alerts: Modern 2026 iterations of this indicator send push notifications to your mobile device the moment price enters the zone.
- Multi-Timeframe Analysis: It can overlay higher timeframe Fibonacci zones onto your current chart, providing a ‘top-down’ perspective.
How to Install and Setup the Indicator on MT4
Setting up the indicator is a straightforward process, but it requires precision to ensure the data feeds are accurate. Follow these steps to get started:
Step 1: Download the Indicator Files
Ensure you have the .ex4 or .mq4 file for the Fibonacci Golden Zone indicator. Many versions are available in the MQL5 marketplace or through specialized trading communities.
Step 2: Access the MT4 Data Folder
Open your MetaTrader 4 platform. Go to File > Open Data Folder. This will open a window on your computer containing all the platform’s internal files.
Step 3: Move the Files
Navigate to MQL4 > Indicators. Copy and paste your downloaded indicator file into this folder.
Step 4: Refresh and Attach
Go back to MT4. In the ‘Navigator’ window, right-click ‘Indicators’ and select ‘Refresh.’ You should now see the ‘Fibonacci Golden Zone’ listed. Simply drag and drop it onto your desired chart.
3 High-Probability Trading Strategies for 2026
Simply having the indicator on your chart isn’t enough. You need a systematic approach to exploit the Golden Zone. Here are three strategies currently favored by professional traders.
Strategy 1: The Trend-Continuity Pullback
This is the bread-and-butter strategy for Fibonacci enthusiasts. It relies on the market moving in a clear direction (higher highs and higher lows).
- Identify the Trend: Use a 200-period Exponential Moving Average (EMA) to determine the long-term trend. Only take buy trades if price is above the 200 EMA.
- Wait for the Zone: Wait for the indicator to draw a Golden Zone after a fresh impulsive move.
- The Entry: Don’t just place a limit order. Wait for a bullish reversal candle (like a Hammer or Bullish Engulfing pattern) to form inside the Golden Zone.
- Stop Loss: Place your stop loss just below the 78.6% retracement level.
Strategy 2: The Confluence Scalp
In the fast-paced markets of 2026, scalping the 1-minute or 5-minute charts requires extra confirmation. This strategy uses the Golden Zone in conjunction with Support and Resistance.
Look for areas where a previous ‘Resistance’ level has flipped to ‘Support’ and aligns perfectly with the Fibonacci Golden Zone. This ‘confluence’ creates a high-density area of buy orders. When price touches this horizontal level and the Fib zone simultaneously, the probability of a bounce increases to over 70%.
Strategy 3: The Counter-Trend Fade (Advanced)
This strategy is for experienced traders who understand market exhaustion. When price extends far beyond its average daily range (ADR) and hits a psychological level (like 1.1000 in EUR/USD) that coincides with a Fibonacci expansion or a deep retracement zone on a higher timeframe, a ‘fade’ or reversal trade can be taken. The Golden Zone acts as the target for the profit-taking of the counter-trend move.
Optimizing Settings for Different Asset Classes
The Fibonacci Golden Zone indicator isn’t a ‘one size fits all’ tool. Depending on what you are trading, you may need to tweak the parameters.
Forex (Major Pairs)
Currency pairs like GBP/USD and USD/JPY are highly liquid. The 61.8% level is incredibly respected here. Standard settings usually work best, but keep an eye on the ‘Swing Depth’ setting in your MT4 indicator properties. A depth of 12-15 is typically ideal for H1 charts.
Crypto (Bitcoin & Ethereum)
Crypto markets are known for ‘over-extension.’ It is common for Bitcoin to pierce through the 61.8% level and tap the 78.6% level before reversing. If you are using the indicator for crypto in 2026, consider widening your Golden Zone to include the 70.7% level, which is the square root of 0.5 and a favorite among institutional crypto desks.
Indices (S&P 500, NASDAQ)
Indices tend to have a bullish bias. Pullbacks to the 50% level are often bought aggressively. If the market is in a parabolic run, the indicator’s 38.2% level often acts as the new floor. Adjust your indicator to highlight the 50% level with more prominence when trading indices.
The Psychology of the Golden Zone
Why does the Golden Zone work? It’s not magic; it’s a self-fulfilling prophecy combined with human psychology. Traders are naturally risk-averse. When a price has run up too high, they are afraid to buy at the ‘top.’ They wait for a ‘sale.’ The 50% to 61.8% retracement feels like a ‘fair price’ to the collective market participants.
Furthermore, because so many retail traders and institutional bots are programmed to look at these exact levels, the sheer volume of orders placed in the Golden Zone creates the very reversal we are looking for. In 2026, where social media and trading communities amplify these ‘popular’ levels, the effect is even more pronounced.
Risk Management: Protecting Your Capital
No indicator is 100% accurate. The Fibonacci Golden Zone Indicator for MT4 is a tool for finding probability, not certainty. To survive the markets in 2026, you must adhere to strict risk management rules:
- Risk per Trade: Never risk more than 1-2% of your account on a single Fibonacci setup.
- The 1:2 Reward Ratio: Ensure your target (usually the 0% level or the -27.2% extension) is at least twice as far as your stop loss.
- News Avoidance: Avoid trading the Golden Zone during high-impact news events like the NFP or Central Bank rate decisions. Volatility during these times can ‘blow through’ your levels regardless of their mathematical significance.
Common Mistakes to Avoid
Even with the best MT4 indicator, beginners often fall into these traps:
- Picking the Wrong Swing: Ensure your indicator is identifying the major swing. Small, insignificant wicks can lead to ‘noise’ Fibonacci levels that don’t hold weight.
- Ignoring the Macro Trend: Don’t try to buy a 61.8% retracement in a market that is clearly in a massive downtrend on the Daily chart. The trend is your friend.
- Over-Complicating: Adding five other indicators to your chart will only lead to analysis paralysis. Trust the Golden Zone and one secondary confirmation (like volume or price action).
Conclusion: The Future of Fibonacci Trading
As we navigate through 2026, the financial markets continue to become more algorithmic and data-driven. Tools like the Fibonacci Golden Zone Indicator for MT4 bridge the gap between complex mathematical theory and practical, actionable trading. By automating the identification of high-interest zones, you allow yourself to focus on what truly matters: execution and discipline.
The Golden Zone isn’t just a place on a chart; it represents the equilibrium between greed and fear. By mastering this indicator, you are aligning yourself with the natural flow of the markets. Start by testing the indicator on a demo account, find the timeframe that suits your personality, and remember that in trading, patience is often more profitable than the most advanced algorithm.