
Implementing Renko Strategy on MetaTrader 5: A Guide to Noise-Free Price Action
The Evolution of Price Action: Why Time is Often the Enemy
For decades, traders have relied on time-based candles to interpret market sentiment. Whether it is a 1-minute scalp or a daily swing trade, the x-axis has always been defined by the clock. However, in the modern trading landscape of 2026, where algorithmic high-frequency trading dominates the intraday noise, time-based charts can often lead to false signals and psychological exhaustion.
This is where the Renko chart comes into play. Derived from the Japanese word ‘renga’ (brick), Renko charts ignore time and focus purely on price movement. If price doesn’t move a specific distance, the chart doesn’t update. This creates a streamlined, ‘clean’ view of the market that filters out the ‘sawtooth’ patterns common in volatile sessions. If you are looking to refine your strategy, finding a reliable Renko chart creator for MT5 is a critical step toward professional-grade technical analysis.
Understanding the Renko Logic on MetaTrader 5
Unlike standard candlestick charts, Renko bricks are only drawn when price moves a predetermined number of points or pips. For instance, if you set a 10-pip brick size, a new brick will only appear once the price has fully traversed that 10-pip distance from the close of the previous brick. If the price fluctuates within a 9-pip range for three hours, a Renko chart remains static, while a 5-minute candlestick chart would have printed 36 messy candles.
In MetaTrader 5 (MT5), the implementation of Renko charts is significantly more robust than its predecessor, MT4. While MT4 required cumbersome ‘offline chart’ workarounds that often crashed or failed to update in real-time, the MT5 architecture allows for more sophisticated ‘Synthetic Symbol’ creation. A high-quality Renko chart creator for MT5 download will typically leverage this capability, generating a custom symbol in your Market Watch that functions just like a live currency pair or CFD.
Criteria for Choosing a Renko Chart Creator for MT5
Not all Renko tools are created equal. When searching for a download, you must differentiate between simple visual overlays and true custom symbol generators. Here are the features you should prioritize in 2026:
1. Non-Repainting Bricks
The most common issue with inferior Renko indicators is ‘repainting.’ This occurs when a brick appears on the chart based on current price but disappears if the price retreats before the bar ‘closes.’ A professional-grade creator ensures that once a brick is printed on the history, it remains there. This is vital for backtesting and developing trust in your entry signals.
2. Support for Wicks
Traditional Renko charts do not show wicks (shadows), only the bodies. However, many modern price action traders prefer to see the price extremes reached during the formation of a brick. A premium creator should give you the toggle option to display wicks, providing insights into rejection levels and liquidity sweeps.
3. Custom Symbol Generation
The best Renko tools for MT5 today don’t just draw boxes on your main screen; they create a new, synthetic instrument. This allows you to apply standard MT5 indicators—like Moving Averages, MACD, or Bollinger Bands—directly onto the Renko bricks as if they were standard candles. This compatibility is a game-changer for systematic traders.
4. ATR-Based Box Sizing
While fixed pip sizes are standard, markets are dynamic. A 10-pip brick on the EUR/USD might be appropriate today but irrelevant during a period of extreme volatility. Advanced creators offer an ‘Average True Range’ (ATR) setting, which automatically adjusts the brick size based on the current market volatility, ensuring your chart remains ‘scaled’ to the environment.
How to Install and Set Up Your Renko Creator
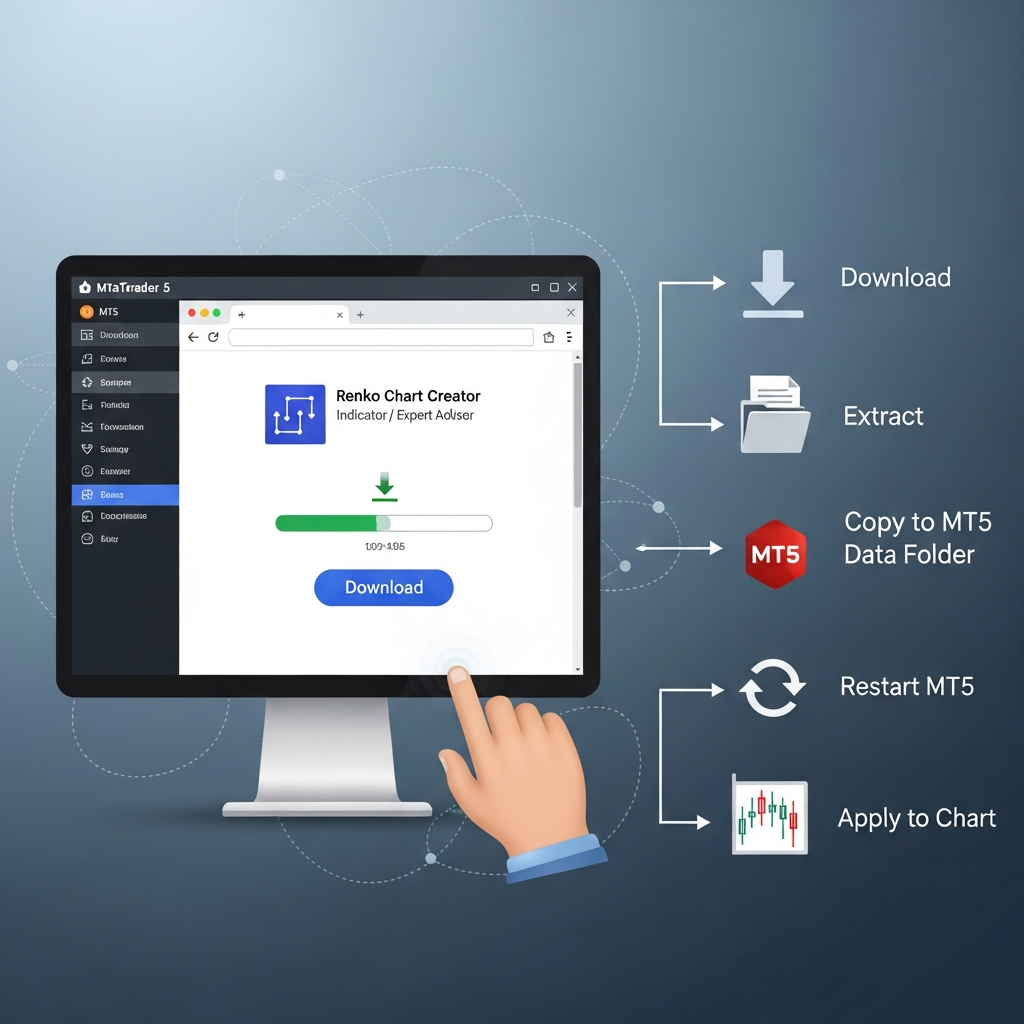
Once you have selected a Renko chart creator for MT5 download, the installation process is straightforward, but requires attention to detail to ensure the data feed remains synchronized.
- Download the Files: You will typically receive an .ex5 file (the indicator or EA).
- Open Data Folder: In MT5, go to File > Open Data Folder. Navigate to MQL5 > Indicators (or Experts, depending on the tool type) and paste the file.
- Refresh and Apply: Restart MT5 or right-click the Navigator window and hit ‘Refresh.’ Drag the tool onto a standard time-based chart (e.g., M1).
- Configure Inputs: This is where you define your brick size. For most major forex pairs, 20-50 points (2-5 pips) is common for scalping, while 100-200 points is used for swing trading.
- Launch the Custom Chart: If the tool creates a synthetic symbol, look for a name like ‘EURUSD_Renko’ in your symbols list. Right-click it and select ‘Chart Window.’
Strategy: Trading the ‘Trend Change’ with Renko
One of the most effective ways to use Renko charts in 2026 is for trend reversal identification. Because Renko filters out the noise, a change in color is often a much stronger signal than a candlestick engulfing pattern.
The Two-Brick Reversal
In a Renko environment, a reversal requires the price to move twice the box size in the opposite direction. For example, if you have 10-pip bricks and the trend is bullish, the price must drop 20 pips to print a single bearish (red) brick. This inherent ‘lag’ is actually a feature, not a bug—it prevents you from being whipped out of a trade by minor retracements.
A high-probability strategy involves combining the Renko chart with a 20-period Exponential Moving Average (EMA). When the Renko bricks are printing above the EMA and are consistently green, you stay in the long position. You only exit when a red brick closes and the price breaks below the EMA. This simple visual clarity is why many institutional desk traders have integrated Renko views into their monitoring stacks.
Renko vs. Mean Renko vs. Range Bars
As you explore downloads, you might encounter variations like ‘Mean Renko’ or ‘Range Bars.’ It is important to understand the distinctions:
- Standard Renko: New bricks start at the top or bottom corner of the previous brick. This is the cleanest for trend following.
- Mean Renko: The brick is centered on the midpoint of the previous price move. This often provides a ‘faster’ look and shows reversals more quickly, though it can introduce more noise.
- Range Bars: Similar to Renko but they only care about the total range (High to Low) of the bar, rather than the move from the previous open/close.
For most traders transitioning from candlesticks, the Standard Renko with Wicks offers the best balance of familiarity and noise reduction.
The Importance of Backtesting in 2026
The MT5 Strategy Tester has seen significant upgrades, making it much more efficient for Renko-based EAs than it was in previous years. If you are downloading a Renko creator to build an automated system, ensure the tool provides ‘Real Tick’ data support. Since Renko is price-dependent, backtesting on ‘1-minute OHLC’ data will yield inaccurate results. You need a creator that can simulate the actual tick movements within each brick to ensure your stop losses and take profits would have triggered correctly in a live environment.
Common Pitfalls to Avoid
While Renko charts look like a ‘holy grail’ due to their clean appearance, they are not without risks. The biggest trap is the ‘Visual Illusion of Smoothness.’ On a historical Renko chart, trends look perfect. However, in real-time, the ‘current’ brick can move up and down significantly before it finally closes. You must wait for the brick close before making a trading decision. Entering mid-brick is essentially the same as chasing price on a time-based chart.
Furthermore, Renko charts do not show volume in the traditional sense. Since every brick represents the same price movement, volume becomes a function of time—how many bricks are produced in an hour? To compensate for this, many traders keep a standard volume indicator or a ‘Time-at-Price’ profile alongside their Renko setup.
Conclusion: Refining Your Edge
Adopting a Renko chart creator for MT5 in 2026 is about more than just a new visual style; it’s about shifting your mindset from ‘When will the market move?’ to ‘How much has the market moved?’ By removing the distraction of the clock, you align your psychology with the actual supply and demand imbalances that drive the market.
Whether you are scalping the S&P 500 or swing trading Bitcoin, the clarity provided by price-based bricks allows for tighter stop losses and more objective exit points. Start by downloading a reputable creator, experiment with ATR-based box sizes on a demo account, and witness how the ‘market noise’ simply disappears, leaving you with the pure intent of price action.