
Mastering the Bollinger Bands Squeeze Indicator for MT5: 2026 Trading Guide
The Calm Before the Storm: Understanding Market Volatility in 2026
In the fast-paced world of financial markets, volatility is the only constant. Whether you are trading forex, crypto, or global equities on MetaTrader 5 (MT5), understanding the ebb and flow of market energy is crucial. One of the most powerful concepts in technical analysis is the ‘Squeeze.’ This phenomenon describes a period of extreme price consolidation that almost inevitably leads to an explosive breakout.
As we navigate the trading landscape of 2026, the Bollinger Bands Squeeze indicator remains a cornerstone for professional traders. In an era where algorithmic trading and high-frequency execution dominate, being able to visually identify when the market is ‘coiling’ like a spring provides a significant edge. This guide will delve deep into the mechanics of the Bollinger Bands Squeeze indicator for MT5, how it functions, and how you can integrate it into a robust trading system.
What is the Bollinger Bands Squeeze?
The concept of the ‘Squeeze’ was popularized by John Carter, though it builds upon the foundational work of John Bollinger. At its core, the strategy identifies periods where volatility has dropped to historically low levels. In technical terms, the Squeeze occurs when the Bollinger Bands (which measure volatility based on standard deviation) move inside the Keltner Channels (which measure volatility based on Average True Range, or ATR).
When the Bollinger Bands are ‘squeezed’ inside the Keltner Channels, it signals that the market is currently in a state of rest. However, markets do not stay quiet forever. The longer the squeeze lasts, the more powerful the eventual breakout tends to be. The Bollinger Bands Squeeze indicator for MT5 automates this observation, providing a clear visual representation of these cycles.
The Mechanics of the MT5 Indicator
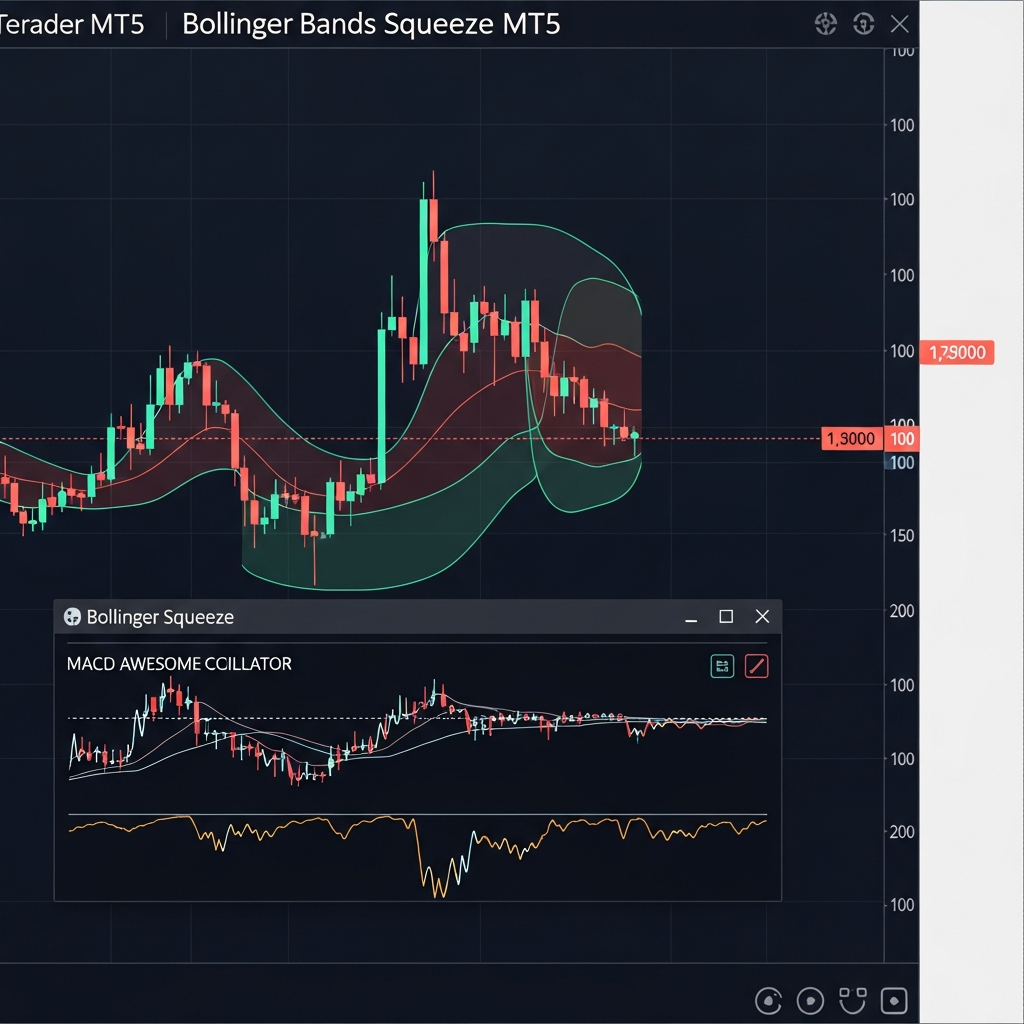
While you could manually plot Bollinger Bands and Keltner Channels on your MT5 chart, the dedicated Squeeze indicator simplifies the process. Usually displayed as a histogram in a separate window below the price action, the indicator provides two primary pieces of information:
- The Squeeze State: Small dots along the zero line of the histogram change color (typically from red to green) to indicate whether a squeeze is currently in progress. Red dots often signify the ‘Squeeze’ is on, while green dots signify the ‘Squeeze’ has been released (a breakout).
- The Momentum: The histogram bars themselves represent the momentum of the price. This is often derived from an oscillator like the MACD or a smoothed Momentum index. The color and height of the bars tell you the direction and strength of the breakout.
Why MetaTrader 5?
MetaTrader 5 has become the gold standard for retail and institutional traders alike in 2026. Its multi-threaded processing power allows indicators to calculate complex math across multiple timeframes without lagging. For a volatility-based indicator like the Squeeze, precision and speed are paramount. The MT5 version of this indicator often includes advanced features like push notifications to your mobile device, email alerts, and even the ability to integrate with Expert Advisors (EAs) for automated trading.
How to Install and Set Up the Squeeze Indicator on MT5
Setting up the indicator is straightforward, but fine-tuning the parameters is where the real skill lies. Once you have downloaded the indicator file (.ex5), follow these steps:
- Open your MT5 platform.
- Go to File > Open Data Folder.
- Navigate to MQL5 > Indicators and paste the file there.
- Restart MT5 or right-click ‘Indicators’ in the Navigator panel and select ‘Refresh’.
- Drag the indicator onto your desired chart.
Key Settings for 2026 Market Conditions
The default settings are often 20 periods for the Bollinger Bands (2.0 standard deviation) and 20 periods for the Keltner Channels (1.5 ATR multiplier). However, in the 2026 market environment—characterized by higher intraday noise—some traders prefer a slightly slower setting, such as a 21 or 25-period moving average, to filter out ‘fakeouts’.
Trading Strategies Using the BB Squeeze
Having the indicator on your chart is only half the battle. You need a disciplined execution strategy. Here are three ways to trade the Squeeze effectively.
1. The Classic Breakout Play
This is the most common use of the indicator. You wait for the squeeze dots to turn from red to green. Once the ‘Squeeze is released,’ you look at the momentum histogram. If the dots turn green and the histogram bars are blue (increasingly positive), you enter a Long position. Conversely, if the dots turn green and the histogram is red (increasingly negative), you enter a Short position.
2. The Multi-Timeframe Confirmation
In 2026, many traders use the ‘Triple Screen’ approach. If you are looking for a trade on the 1-hour chart (H1), you check the 4-hour (H4) chart to see if it is also in a squeeze. If both timeframes are squeezing simultaneously, the resulting breakout is often much more significant. This ‘nested’ squeeze is a favorite among professional swing traders.
3. Fading the False Breakout
Markets often ‘test’ one direction before moving in the actual intended direction. This is known as a head-fake. By waiting for the first few bars of the histogram to establish a trend after the squeeze is released, you can avoid being trapped by these initial price spikes. Look for a consistent increase in histogram height as a sign of genuine institutional participation.
Combining the Squeeze with Other Indicators
No indicator is an island. To increase your win rate on MT5, consider pairing the Bollinger Bands Squeeze with the following tools:
- Volume Weighted Average Price (VWAP): In 2026, VWAP is essential for understanding where the ‘fair value’ of an asset lies. If the Squeeze breaks out above the VWAP, the bullish signal is much stronger.
- Relative Strength Index (RSI): Use RSI to ensure you aren’t buying into an overextended market. A squeeze breakout combined with an RSI reading of 50-60 is often healthier than one starting at an RSI of 80.
- Support and Resistance Levels: The Squeeze indicator identifies when a move might happen, but horizontal levels tell you where the targets are. Always align your squeeze signals with major daily or weekly levels.
Managing Risk and Avoiding Common Pitfalls
The biggest mistake traders make with the Bollinger Bands Squeeze indicator is entering too early. It is tempting to try and ‘predict’ the direction of the squeeze while the dots are still red. However, a squeeze is a neutral state; the market is building pressure, but that pressure can be released in either direction. Always wait for the momentum histogram to confirm the direction.
The ‘Squeeze That Never Ends’
Sometimes, a market can remain in a squeeze for a very long time, especially during holiday periods or ahead of major central bank announcements. During these times, the indicator may produce several ‘false starts’ where the dots turn green for one bar and then immediately back to red. In 2026, smart traders use an economic calendar integrated into MT5 to avoid trading squeezes right before high-impact news events like the FOMC or NFP.
The Role of AI and Automation in 2026
As we look at the current state of trading in 2026, the Bollinger Bands Squeeze has also found its way into many automated systems. MT5’s MQL5 language is robust enough to handle neural networks and machine learning. Some advanced versions of the Squeeze indicator now use ‘Adaptive ATR’ which adjusts the Keltner Channels based on current market sentiment data, reducing the lag even further.
If you are a coder, you can easily write a script in MT5 that scans the top 28 currency pairs or the top 500 stocks for an active Squeeze. This saves hours of manual charting and ensures you never miss a high-potential setup.
Conclusion: Why the Squeeze Still Matters
The Bollinger Bands Squeeze indicator for MT5 is more than just a colorful histogram; it is a visual representation of the fundamental laws of physics applied to finance. Just as a physical spring stores energy when compressed, the market stores financial energy during a squeeze. By the time we’ve reached 2026, the technology behind the indicator has improved, but the human psychology of fear and greed—which creates these volatility cycles—remains the same.
Whether you are a scalper looking for quick moves on the 5-minute chart or a long-term investor seeking the start of a new trend on the weekly chart, the BB Squeeze is an indispensable tool. Practice with it on a demo account, understand its nuances, and always remember that risk management is the key to longevity in the markets. When the volatility finally arrives, make sure you are on the right side of the histogram.