Mastering Market Cycles: The Rise of Wyckoff Theory Automated Marking Indicators
The Evolution of Tape Reading: From Richard Wyckoff to Algorithmic Precision
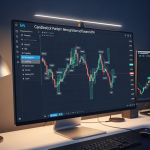
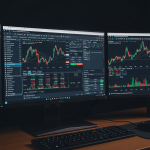
For over a century, the principles laid down by Richard D. Wyckoff have served as the bedrock for understanding market dynamics. Wyckoff’s core philosophy—that the market is a battleground of supply and demand driven by the ‘Composite Man’—remains as relevant today as it was in the early 1900s. However, as we navigate the trading landscape of 2026, the method of applying these principles has undergone a radical transformation. The days of manual chart marking, subjective bias, and hours spent staring at a ticker tape are being replaced by the Wyckoff theory automated marking indicator.
To the uninitiated, Wyckoff theory can seem like an impenetrable wall of jargon: springs, upthrusts, signs of strength (SOS), and preliminary support (PS). For the experienced trader, these terms represent the footprints of institutional money. The challenge has always been the subjectivity of identification. Where one trader sees a valid accumulation phase, another sees a redistribution. Automation is bridging this gap, providing a systematic approach to market structure that levels the playing field for retail and professional traders alike.
The Three Laws of Wyckoff in the Digital Age
Before diving into how automation works, it is essential to understand the logic that these indicators are programmed to follow. Every sophisticated Wyckoff automated indicator is built upon three fundamental laws:
1. The Law of Supply and Demand
This law dictates the direction of price movement. When demand exceeds supply, prices rise; when supply exceeds demand, prices fall. Automated indicators today do more than just look at price; they analyze volume deltas and order flow to determine the true weight of the market’s ‘hidden’ supply and demand.
2. The Law of Cause and Effect
Wyckoff posited that for a change in price (effect) to occur, there must first be a period of preparation (cause). In technical terms, this is the accumulation or distribution phase. An automated tool calculates the ‘length’ of these horizontal ranges to project potential price targets, often using Point and Figure (P&F) logic converted into modern candle-based algorithms.
3. The Law of Effort vs. Result
This is where volume spread analysis (VSA) comes into play. If price moves with massive volume but fails to make a new high, there is a divergence. Automated indicators flag these ‘Effort vs. Result’ anomalies instantly, highlighting potential reversals that the human eye might overlook during high-volatility sessions.
How Automated Marking Indicators Work
Modern automated marking indicators are not mere ‘overlays.’ They are complex scripts, often written in advanced versions of Pine Script or Python, that scan price action for specific structural fingerprints. Here is how they handle the heavy lifting:
Structural Phase Mapping
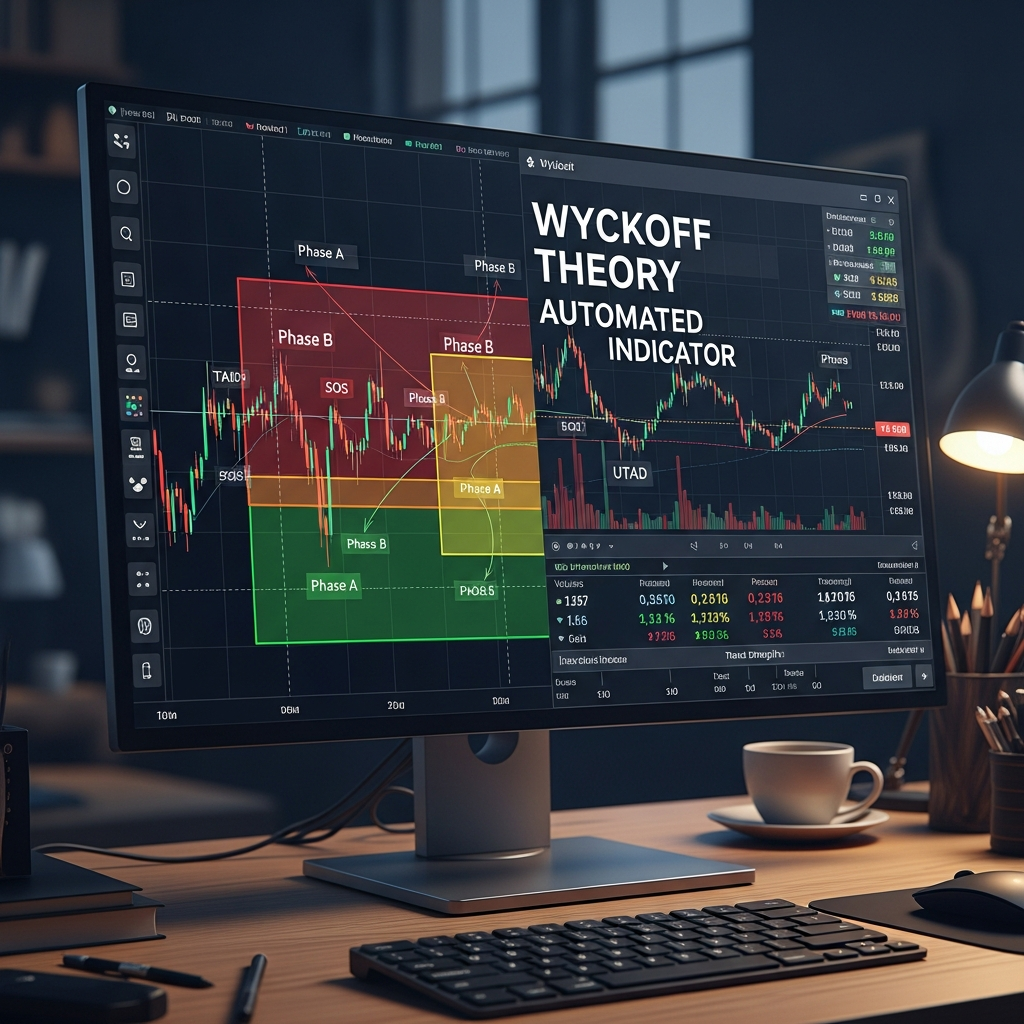
A true Wyckoffian cycle consists of five distinct phases (A through E). Manually identifying the transition from Phase A (stopping the previous trend) to Phase B (building the cause) is notoriously difficult. Automated indicators use peak-and-trough analysis to define the ‘Trading Range’ (TR). Once the range is established, the algorithm monitors for a ‘Spring’ or ‘Upthrust’—the classic false breakout designed to trap liquidity. By the time price reaches Phase D (the breakout), the indicator has already colored the background or tagged the lows, providing the trader with high-confidence entries.
Real-Time Labeling of SOS and SOW
Signs of Strength (SOS) and Signs of Weakness (SOW) are the minor ripples within a larger range that indicate which side is winning. Automating this means the indicator looks for ‘jump across the creek’ movements—high-momentum bars that clear previous resistance levels. Instead of the trader questioning if a move was ‘strong enough,’ the indicator applies a quantitative filter to volume and range to provide an objective label.
The Advantages of Automation in 2026
As we move deeper into 2026, the speed of the market continues to increase. High-frequency trading (HFT) and institutional algorithms dominate the order book. In this environment, manual marking has several significant drawbacks that automation solves.
Eliminating Cognitive Bias
Human beings are naturally predisposed to see what they want to see. If you are bullish, your brain will find an ‘Accumulation’ schematic in even the most bearish of charts. An automated marking indicator has no such bias. It follows the math. If the criteria for a ‘Last Point of Support’ (LPS) aren’t met, the label doesn’t appear. This forced objectivity is the single greatest edge automation provides.
Multi-Timeframe Synchronization
Wyckoff theory is fractal. An accumulation on a 5-minute chart might be part of a larger distribution on a 4-hour chart. Keeping track of these nested cycles manually is a cognitive nightmare. Automated indicators can aggregate data from multiple timeframes, showing you the ‘Point of Control’ across different horizons and warning you when a micro-accumulation is running into a macro-supply zone.
Scalability for Diversified Portfolios
In the past, a Wyckoff trader might only follow two or three assets because the manual analysis was so intensive. With automated marking, a trader can screen hundreds of assets across crypto, forex, and equities. The indicator can send alerts when a specific schematic—such as a ‘Phase C Spring’—is detected on any ticker, allowing the trader to focus only on the most high-probability setups.
Dissecting the Accumulation Schematic
To understand the power of an automated tool, let’s look at what it identifies in a standard Accumulation schematic:
- Preliminary Support (PS): The first sign of significant buying after a long downtrend.
- Selling Climax (SC): A panic sell-off on high volume that marks the temporary bottom.
- Automatic Rally (AR): The initial bounce that defines the top of the trading range.
- Secondary Test (ST): Price returns to the SC area to see if supply has dried up.
- The Spring: A ‘shakeout’ below the SC/ST lows. This is the indicator’s most crucial signal.
An automated indicator calculates the volume profile of the Spring. If the volume is low during the shakeout, it confirms that supply is exhausted—a ‘test’ of the lows. The indicator then marks the ‘Sign of Strength’ as price rallies back into the range. This sequence, which used to take years of practice to master, is now visualized in real-time.
The Pitfalls: Why Automation Isn’t a ‘Holy Grail’
Despite the technological leaps we have seen by 2026, it is vital to remember that an automated indicator is a tool, not a crystal ball. There are nuances that even the most advanced machine learning models can struggle with.
The Problem of ‘Dirty’ Data
In markets with fragmented liquidity, such as certain altcoins or OTC stocks, volume data can be misleading. Since Wyckoff theory relies heavily on the relationship between price and volume, an indicator fed with inaccurate data will produce ‘dirty’ markings. A professional trader always cross-references the indicator’s output with reliable volume sources.
Context is Still King
No indicator knows what the Federal Reserve is going to say in ten minutes or what a sudden geopolitical event might do to the markets. An automated Wyckoff tool marks the *history* and the *current structure*, but the trader must provide the context. Is this distribution happening at a multi-year high? Is the market in a broad ‘risk-off’ environment? These are qualitative assessments that supplement the quantitative labels of the indicator.
Integrating the Indicator into a 2026 Trading Strategy
Successful traders in 2026 don’t just ‘blindly follow the labels.’ They use the automated marking indicator as a primary filter. A typical workflow might look like this:
- Scanning: The trader uses a screener to find assets where the automated indicator has flagged a ‘Phase B’ accumulation.
- Refinement: The trader zooms into a lower timeframe to look for a micro-spring or a ‘Last Point of Support’ (LPS).
- Confirmation: The trader checks for confluence with other tools, such as the Volume Weighted Average Price (VWAP) or Order Flow imbalances.
- Execution: Entry is taken on the ‘Sign of Strength’ (SOS) following the automated marking, with a stop-loss placed just below the Spring identified by the algorithm.
Key Features to Look for in a Wyckoff Indicator
If you are searching for an automated solution, not all indicators are created equal. Look for these specific features that define institutional-grade tools in 2026:
- Zig-Zag Filtering: The ability to adjust sensitivity to price swings so the indicator doesn’t get ‘noisy’ during consolidation.
- Volume Profile Integration: Indicators that show the ‘Value Area’ within the schematic give a much clearer picture of where the Composite Man is building his position.
- Customizable Schematics: Markets change. An indicator should allow you to toggle between standard Wyckoff schematics and ‘truncated’ or ‘sloping’ versions, which are becoming more common in modern markets.
- Divergence Detection: Built-in logic that compares the momentum of the current phase to the previous one to detect ‘exhaustion’ automatically.
The Future of Wyckoff Analysis
As we look toward the future, the integration of Artificial Intelligence with Wyckoff theory is the next logical step. We are already seeing indicators that use ‘Pattern Matching’ neural networks to compare the current chart structure against thousands of historical accumulation and distribution phases. This doesn’t just mark the chart; it provides a probability score for the next move.
However, the heart of the Wyckoff method remains human. It is about understanding the psychology of the market. The automated indicator simply removes the ‘busy work,’ allowing the trader to step back and think like a strategist rather than a clerk. By systematizing the identification of market phases, we can finally trade with the same clinical precision as the institutions we seek to follow.
Conclusion
The Wyckoff theory automated marking indicator represents the perfect marriage of traditional market wisdom and modern computational power. It honors the legacy of Richard Wyckoff by applying his ‘Laws’ with a level of consistency and speed that he could only have dreamed of. Whether you are a seasoned pro or a newcomer, leveraging these tools in 2026 is no longer a luxury—it is a necessity for those who want to navigate the complexities of the global financial markets with clarity and confidence.